The Latest Quarter At A Glance
Data on India’s Gross Domestic Product for Quarter 2 of the 2024-25 fiscal year has just been published. Here are some highlights:
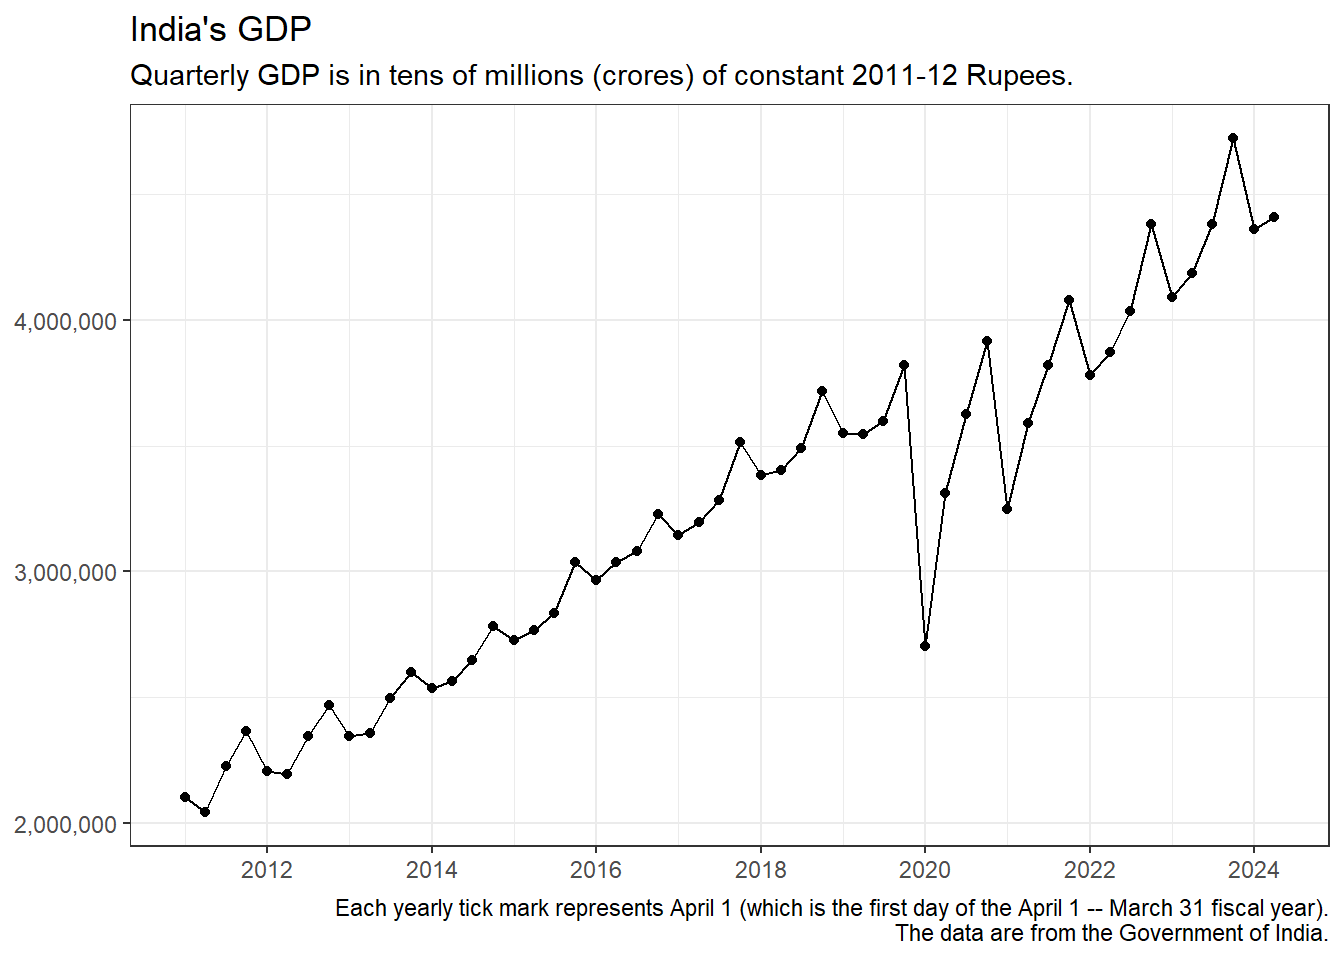
- Inflation-adjusted Gross Domestic Product was INR 4,410,322.90 crores at constant 2011-12 prices. (A crore is ten million or 107.)
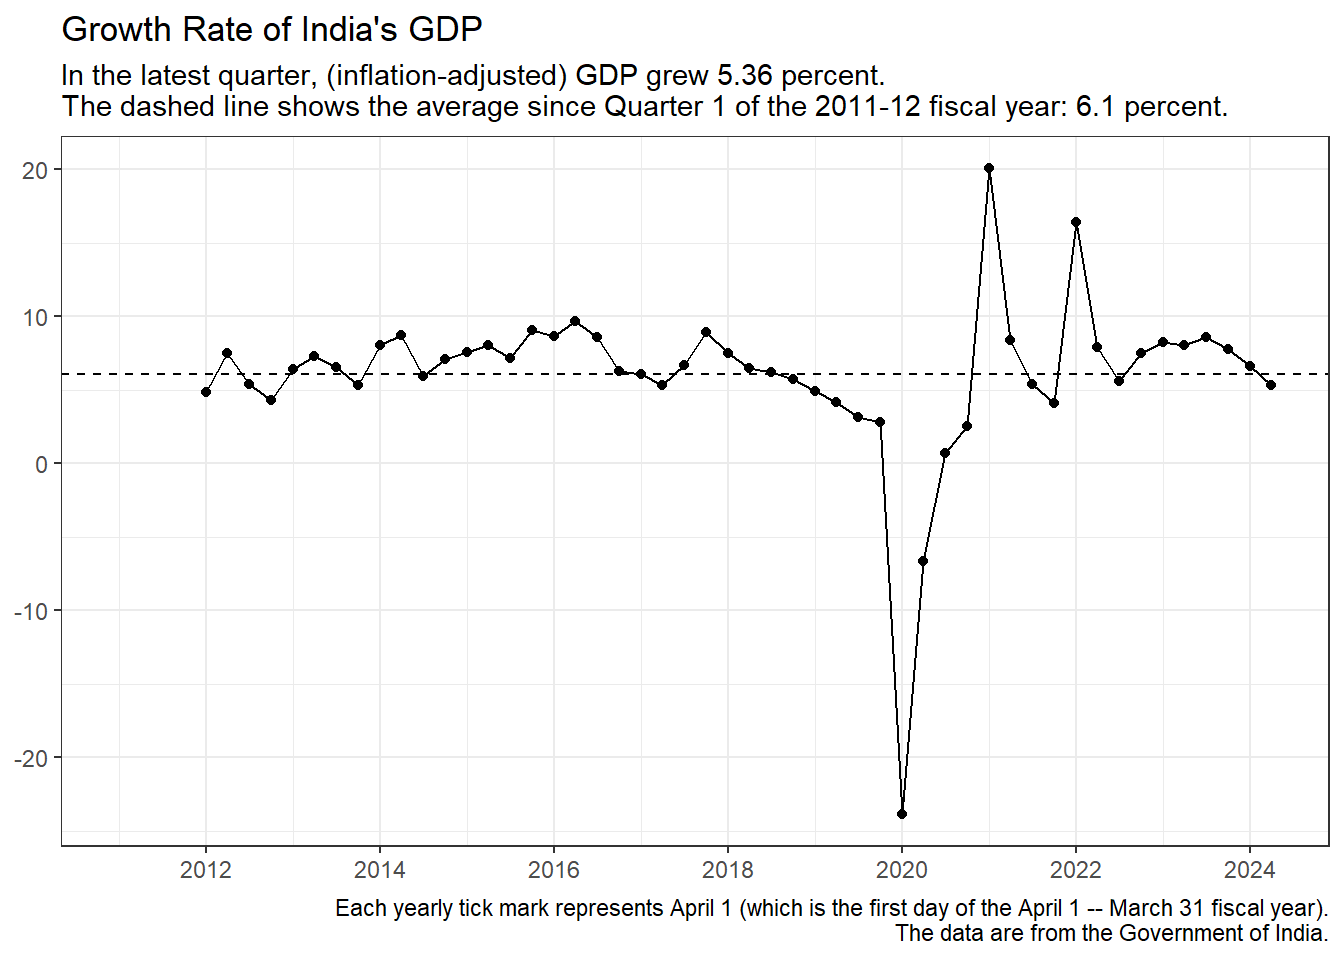
- This represents a growth of 5.36 percent compared to the same quarter in the previous fiscal year. (The available quarterly data spans Quarter 1 of the 2011-12 fiscal year through Quarter 2 of the 2024-25 fiscal year. That’s 13 years. Over the past 13 years, GDP has grown 6.1 percent annually.)
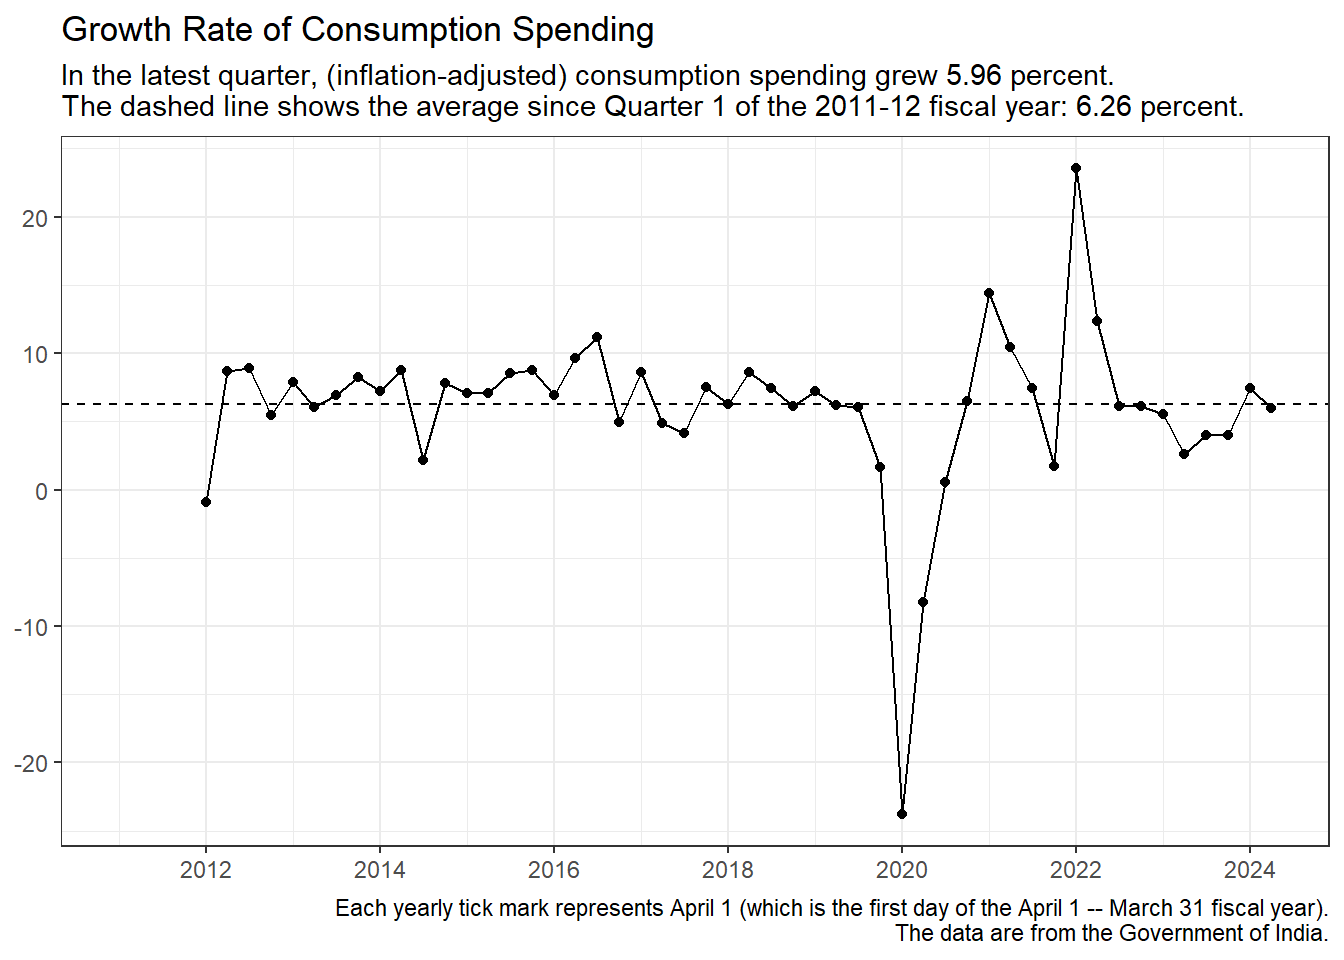
- Consumption spending grew 5.96 percent. (Over the past 13 years, consumption spending has grown 6.26 percent annually.)
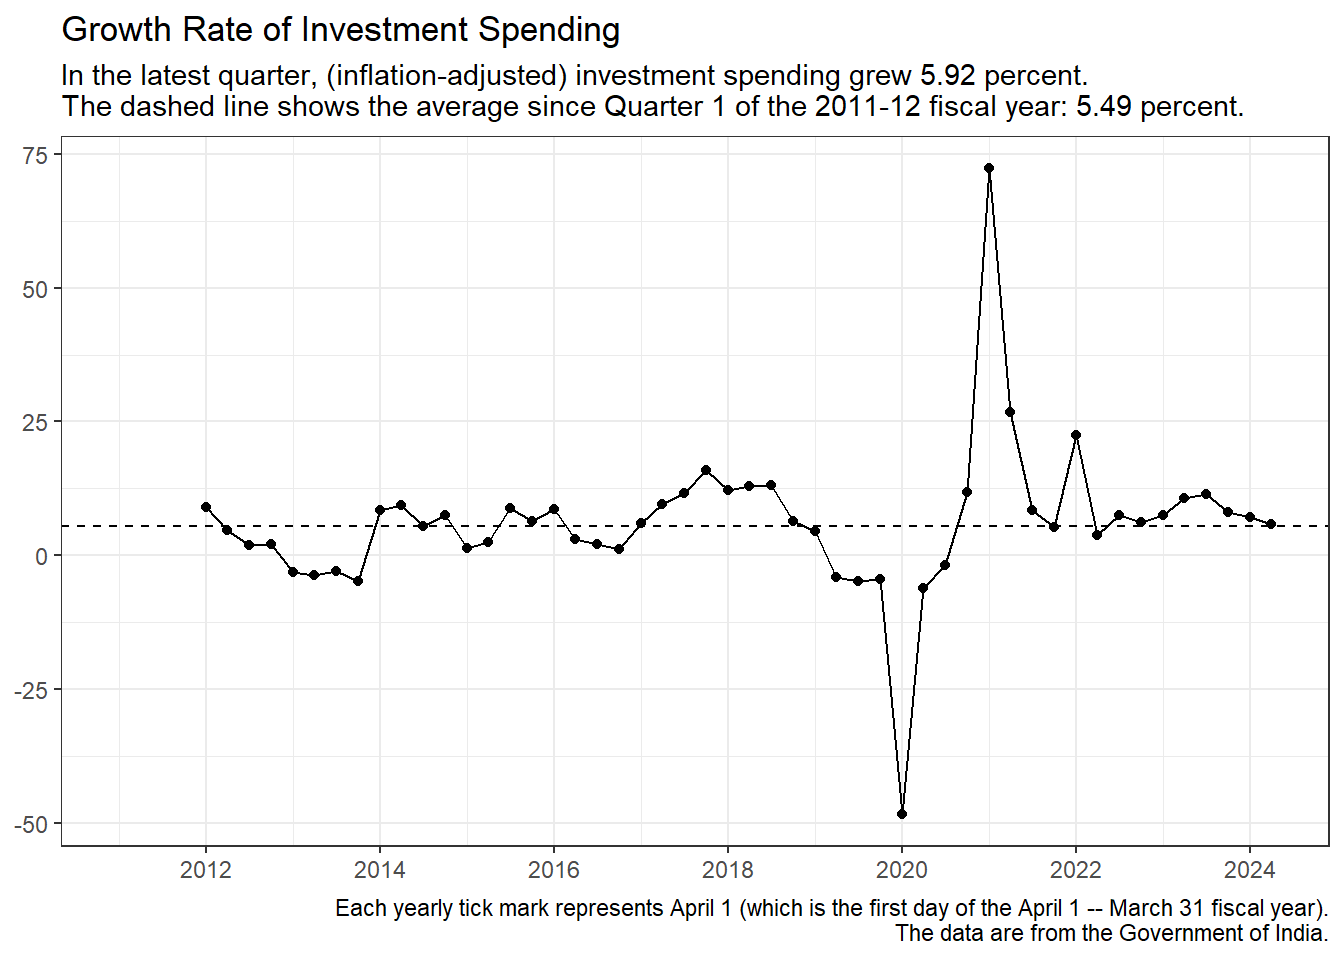
- Investment spending grew 5.92 percent. (Over the past 13 years, investment spending has grown 5.49 percent annually.)
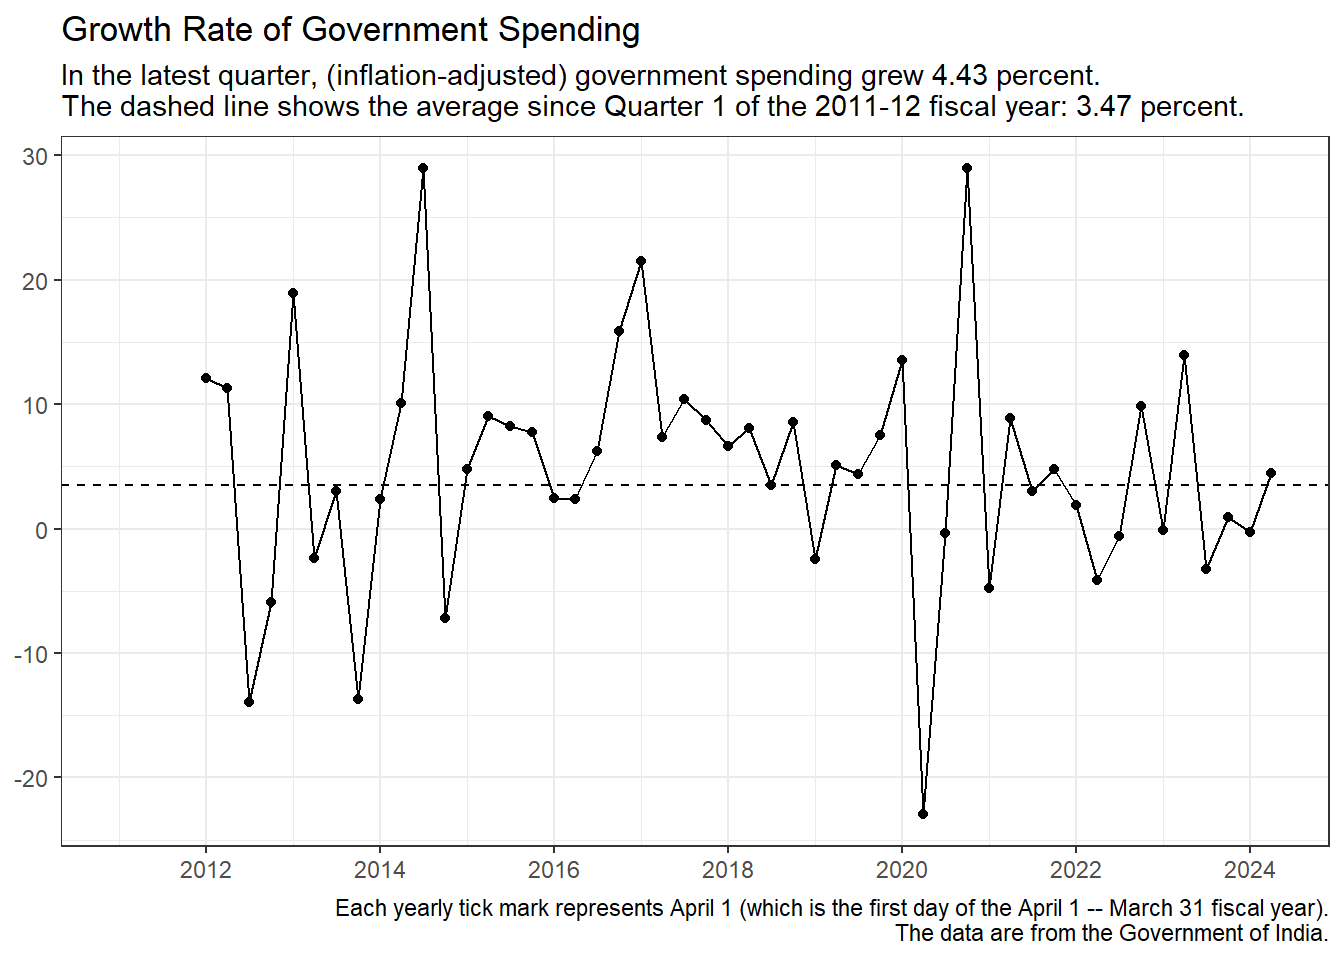
- Government purchases grew 4.43 percent. (Over the past 13 years, government purchases has grown 3.47 percent annually.)
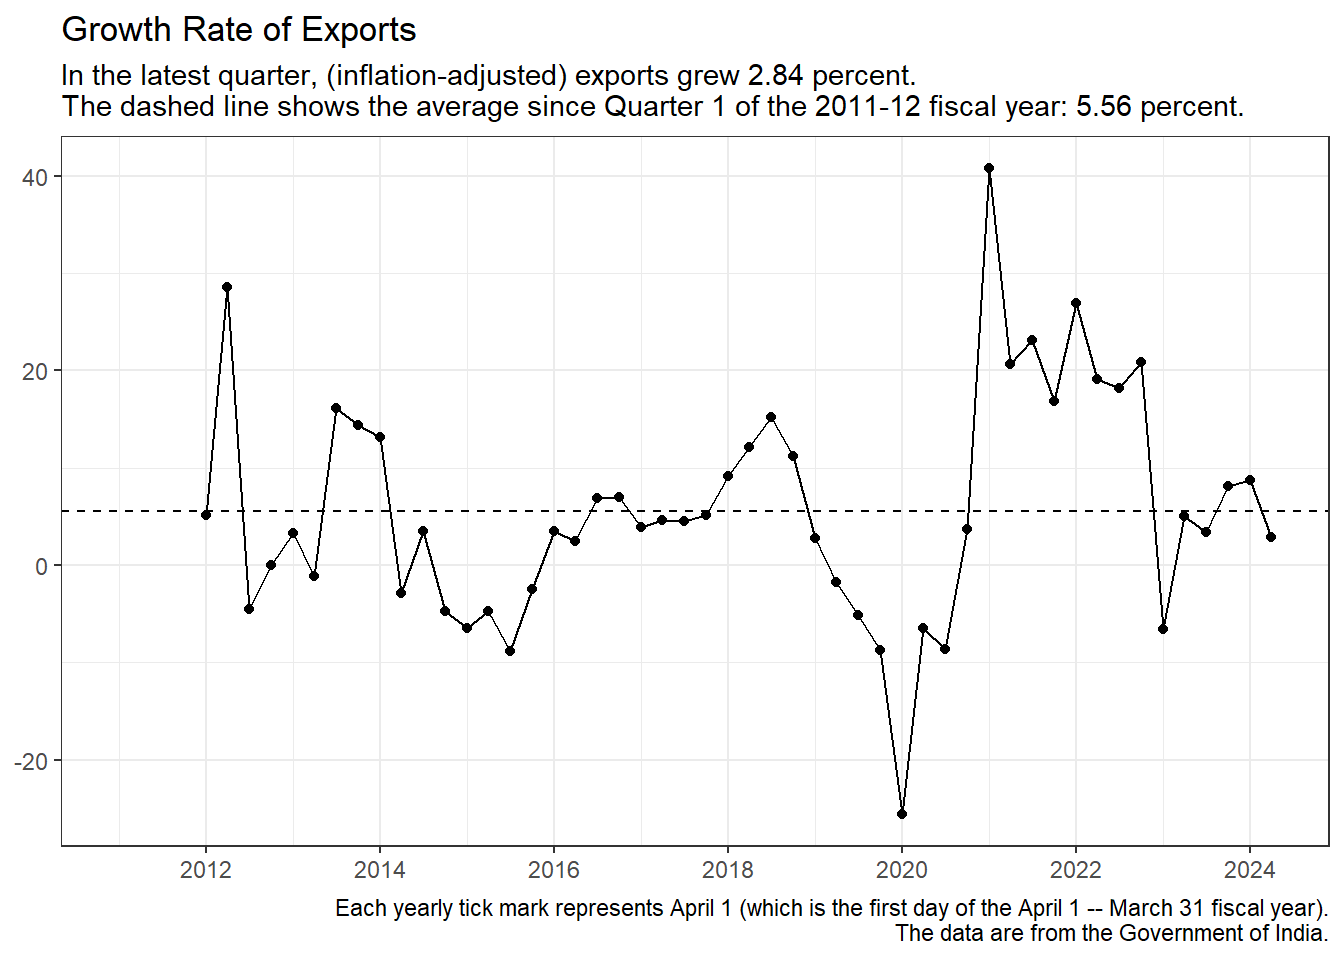
- Exports grew 2.84 percent. (Over the past 13 years, exports has grown 5.56 percent annually.)
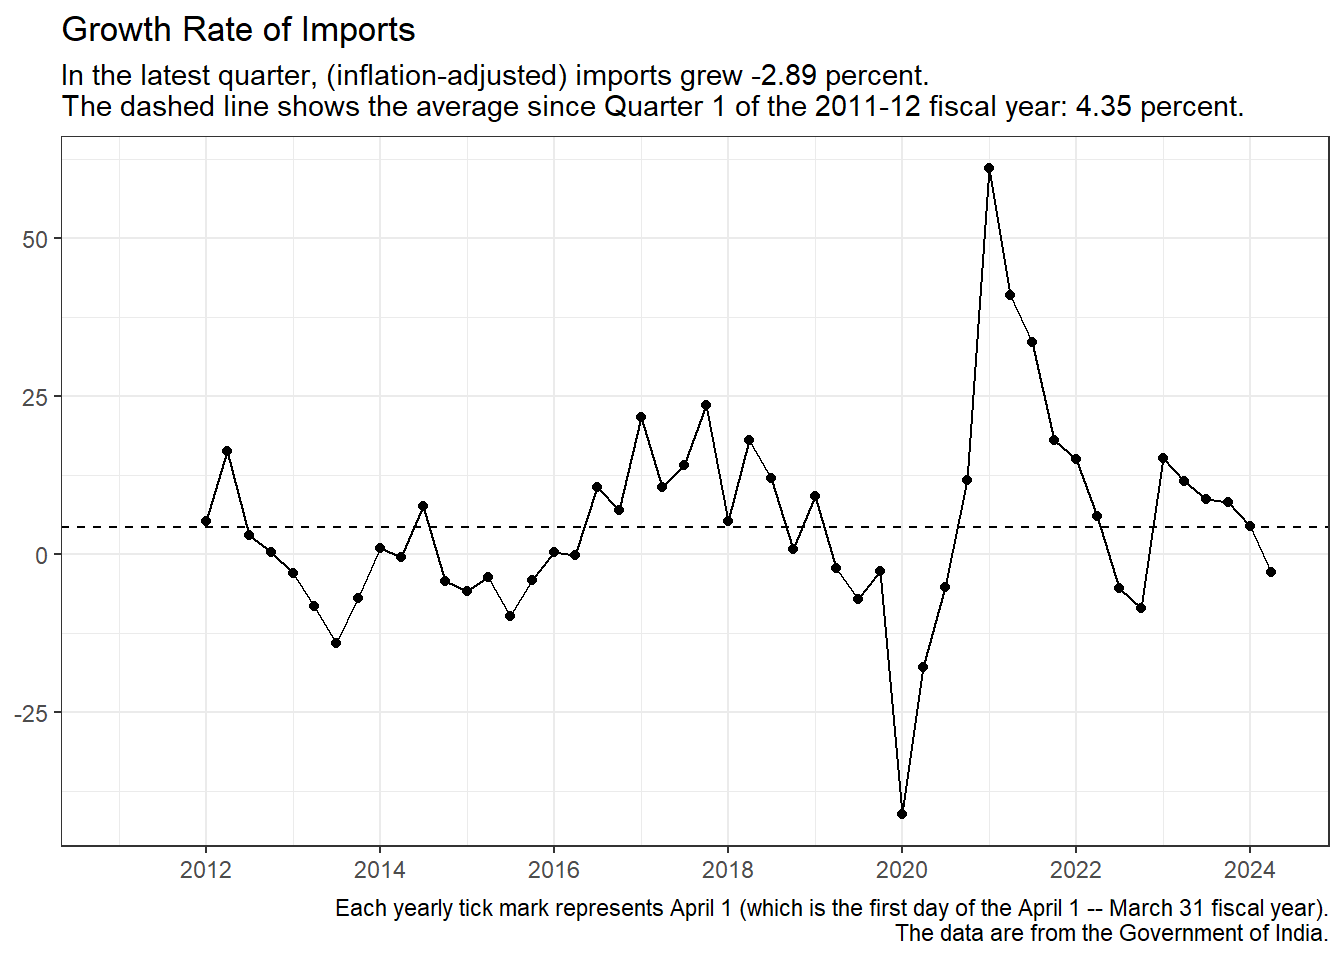
- Imports grew -2.89 percent. (Over the past 13 years, imports has grown 4.35 percent annually.)
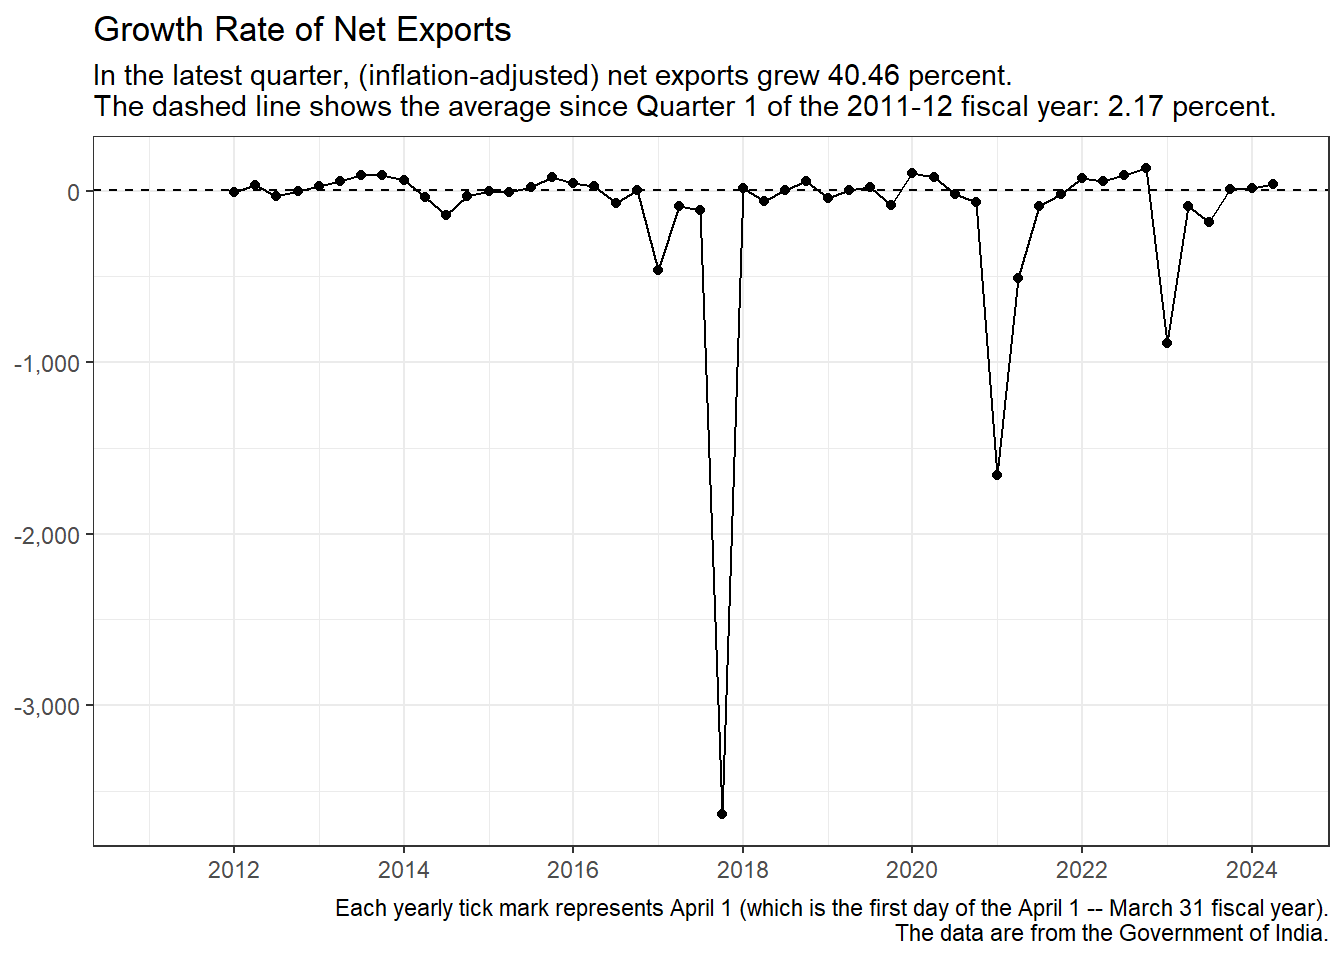
- Net Exports grew 40.46 percent. (Over the past 13 years, net exports has grown 2.17 percent annually.)
- Summary of the latest quarter: Weaker than usual. GDP growth was below the long-run average, dragged down by slower growth in consumption spending. Investment spending and government purchases both grew faster than they usually do. Exports grew significantly slower than usual. Imports shrank.
Gross Domestic Product, Level
Comment: Just eyeball the pre-pandemic and post-pandemic parts of the chart for a second or two. Note the increased volatility after the pandemic, with sharp declines in the first quarter of each year followed by equally sharp increases in the subsequent quarters. I wonder why this is so. Things seem to be returning to the pre-pandemic pattern (of mild increases). However, the question remains: Why has the first quarter (April – June) been so far below the pre-pandemic trend after the pandemic? More puzzlingly, why has fourth quarter (January – March) been so close to the pre-pandemic trend?
Gross Domestic Product, Growth Rate
The Components of GDP (C, I, G, and NX)
GDP is the rupee value of all production, roughly speaking. Consequently, GDP is also total income and total spending. Total spending is usually broken down into four components:
- consumption spending (C, which is present oriented),
- investment spending (I, which is future oriented),
- government purchases (G), and
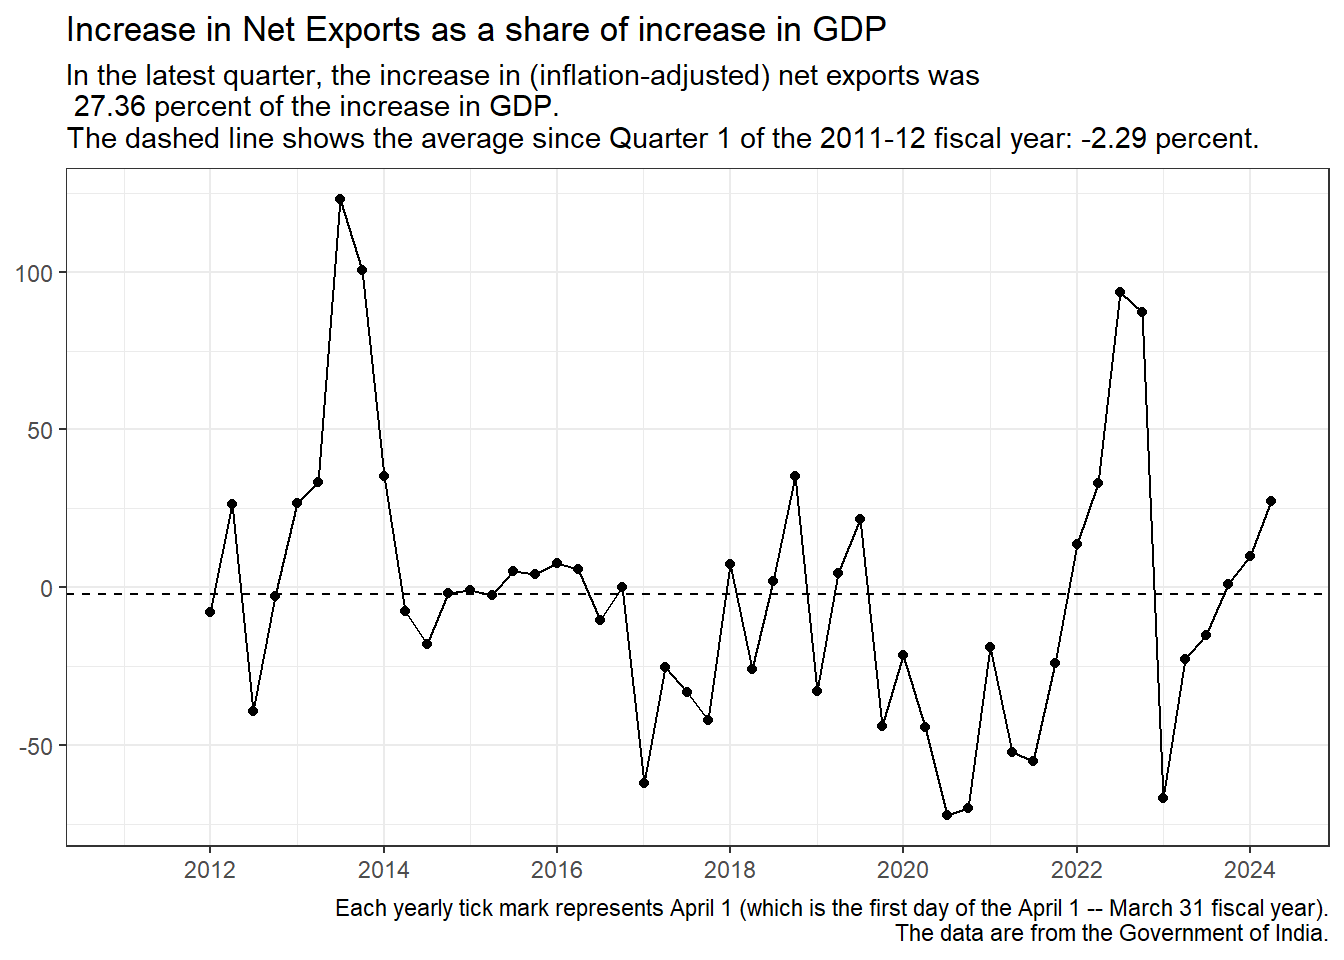
- net exports (NX = Exports - Imports).
Therefore, GDP = C + I + G + NX. It is important to know which kind of spending – that is, which component of GDP – contributes how much to GDP and its growth. Policy makers may be able to design better macroeconomic policies if they can spot the component that is causing trouble.
There are a dozen charts below, three for each of the four components.
- The first of the three charts for a particular component shows that component’s growth rate over the previous year.
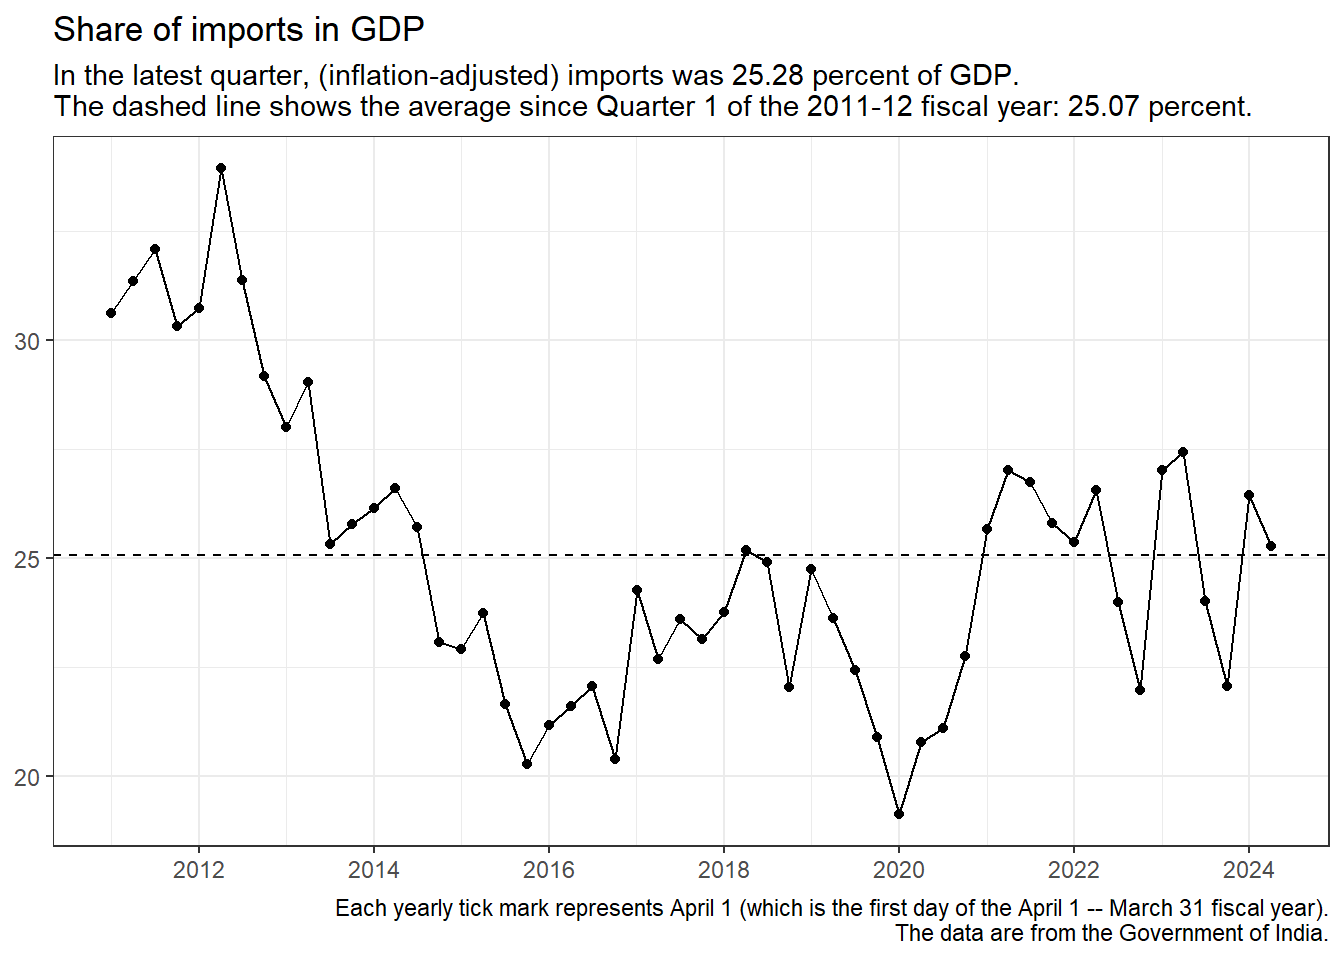
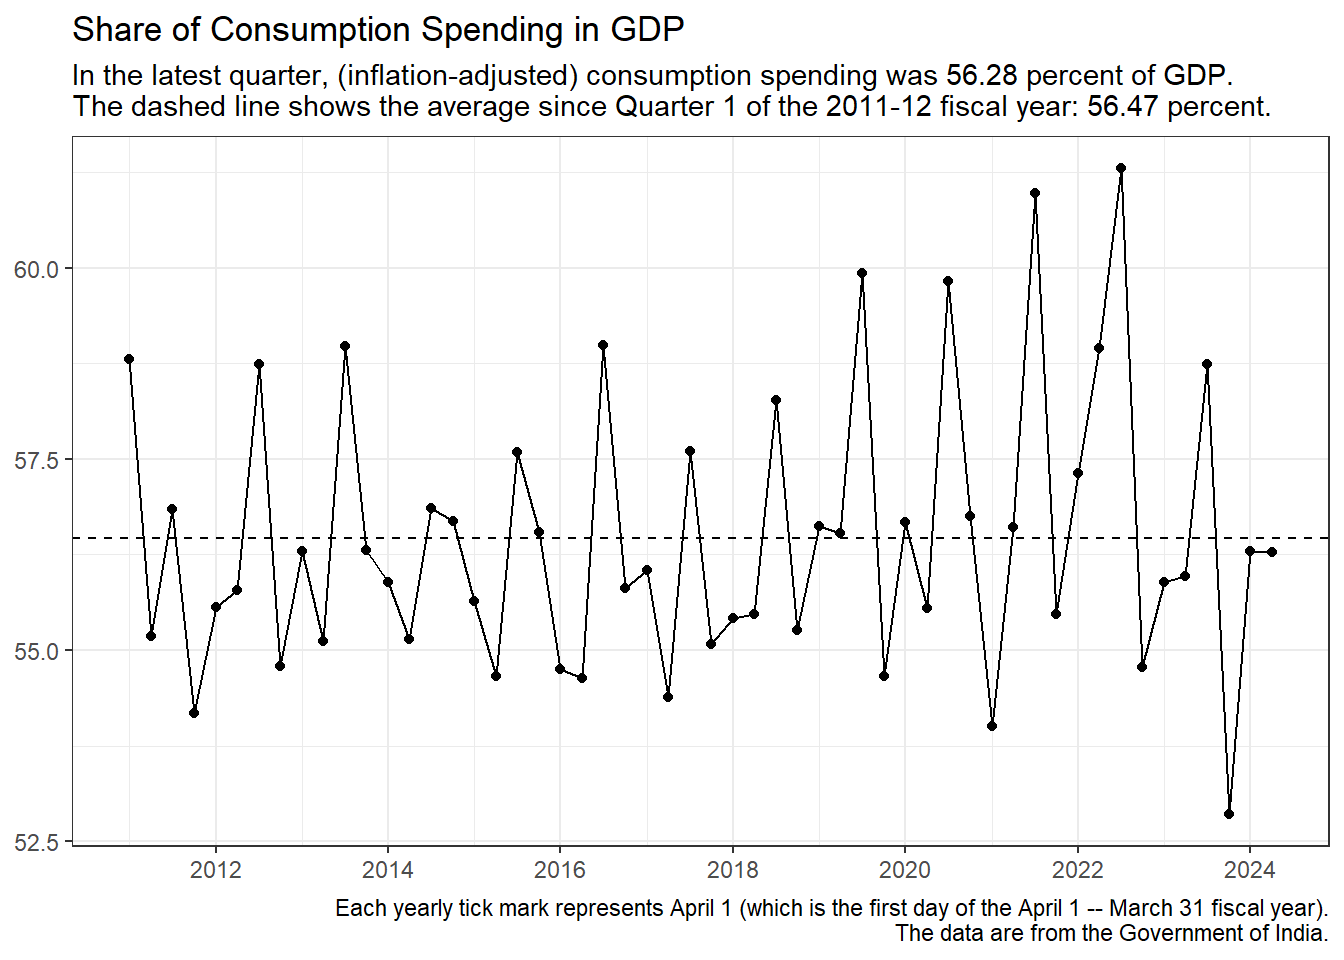
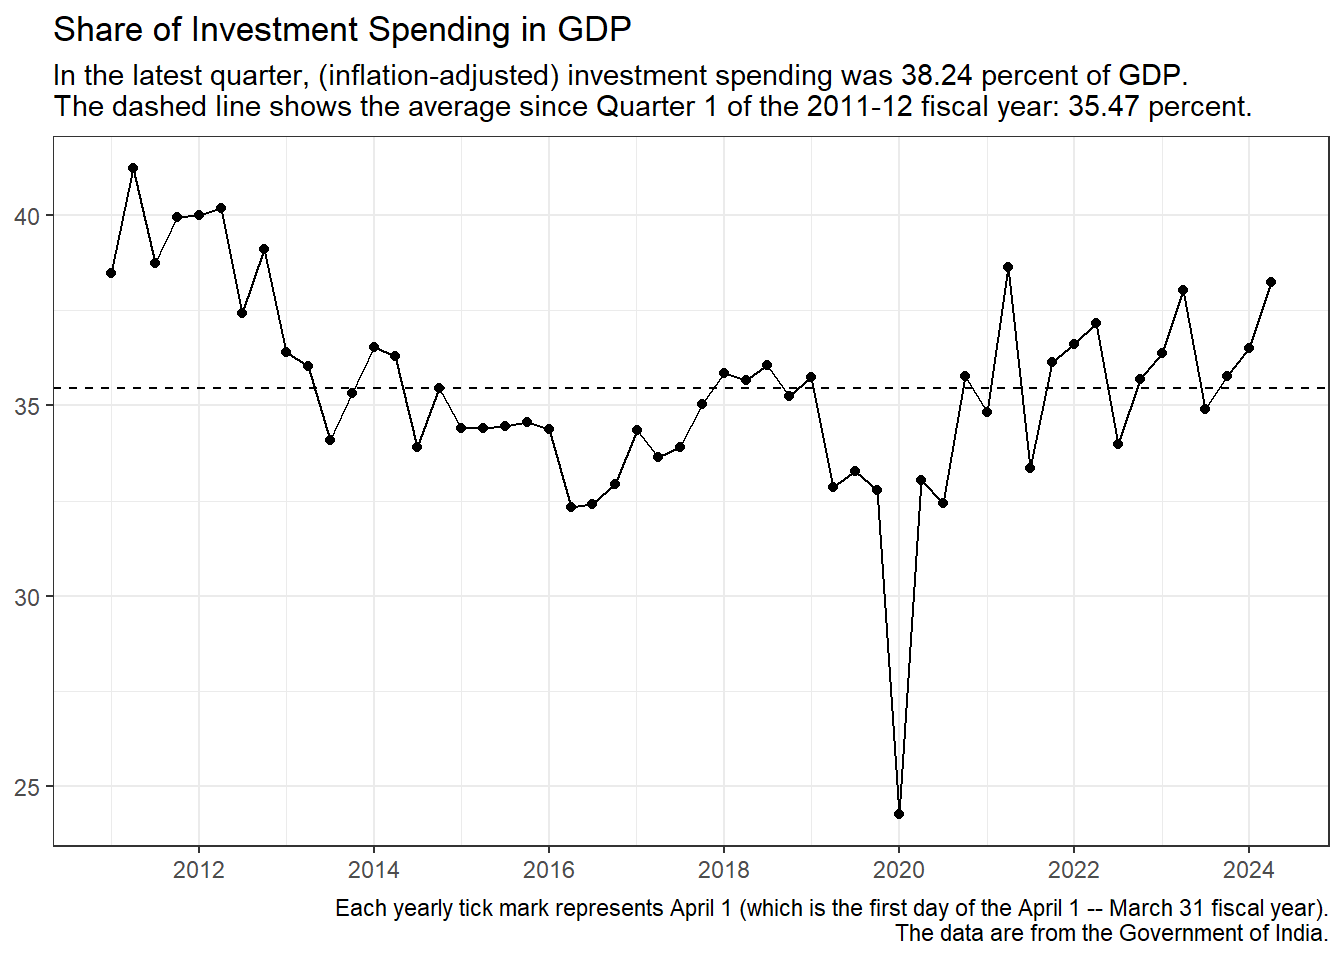
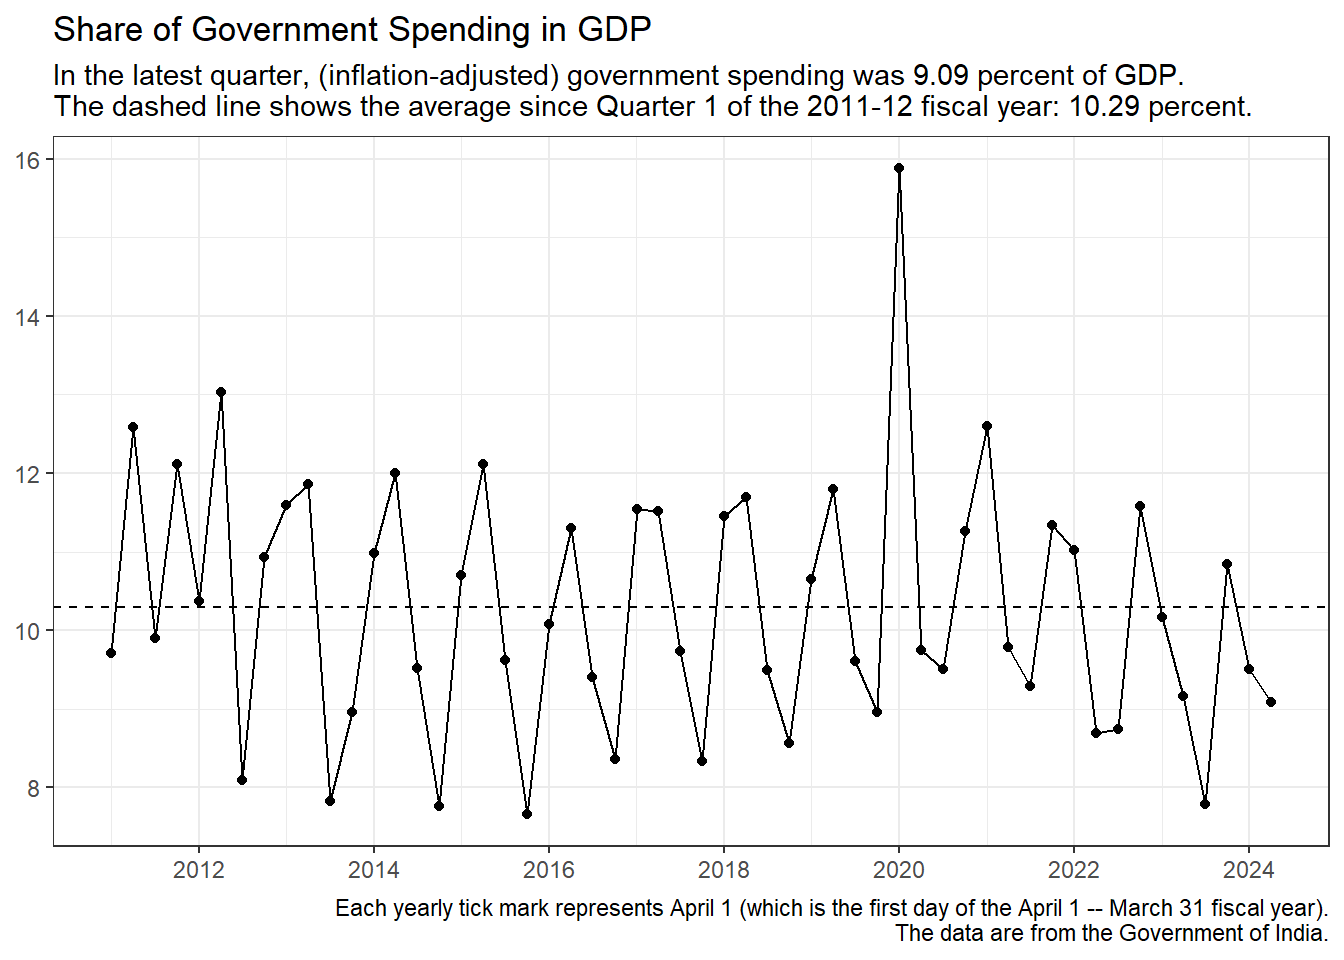
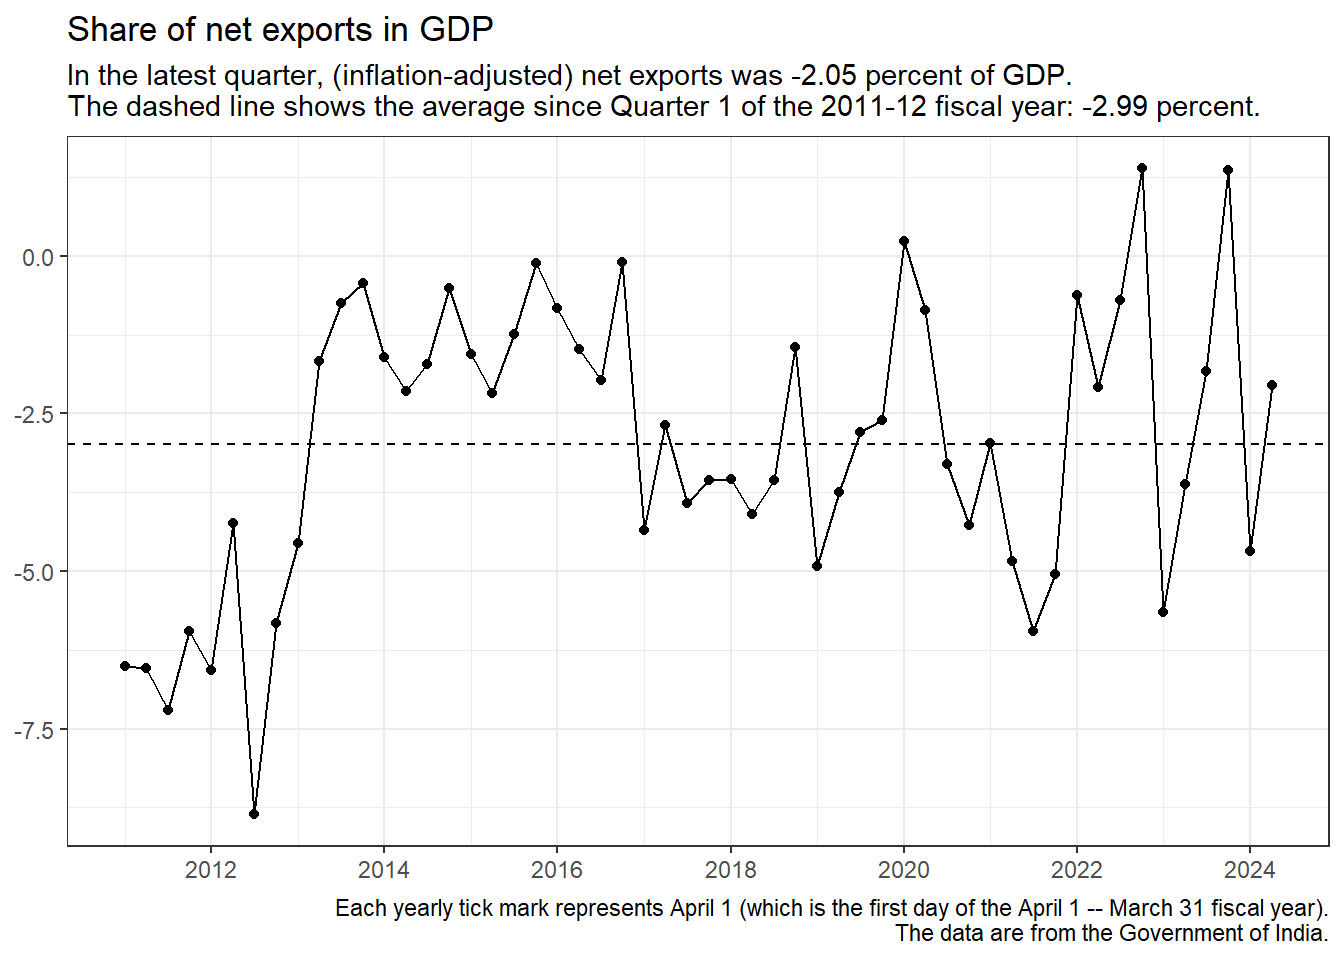
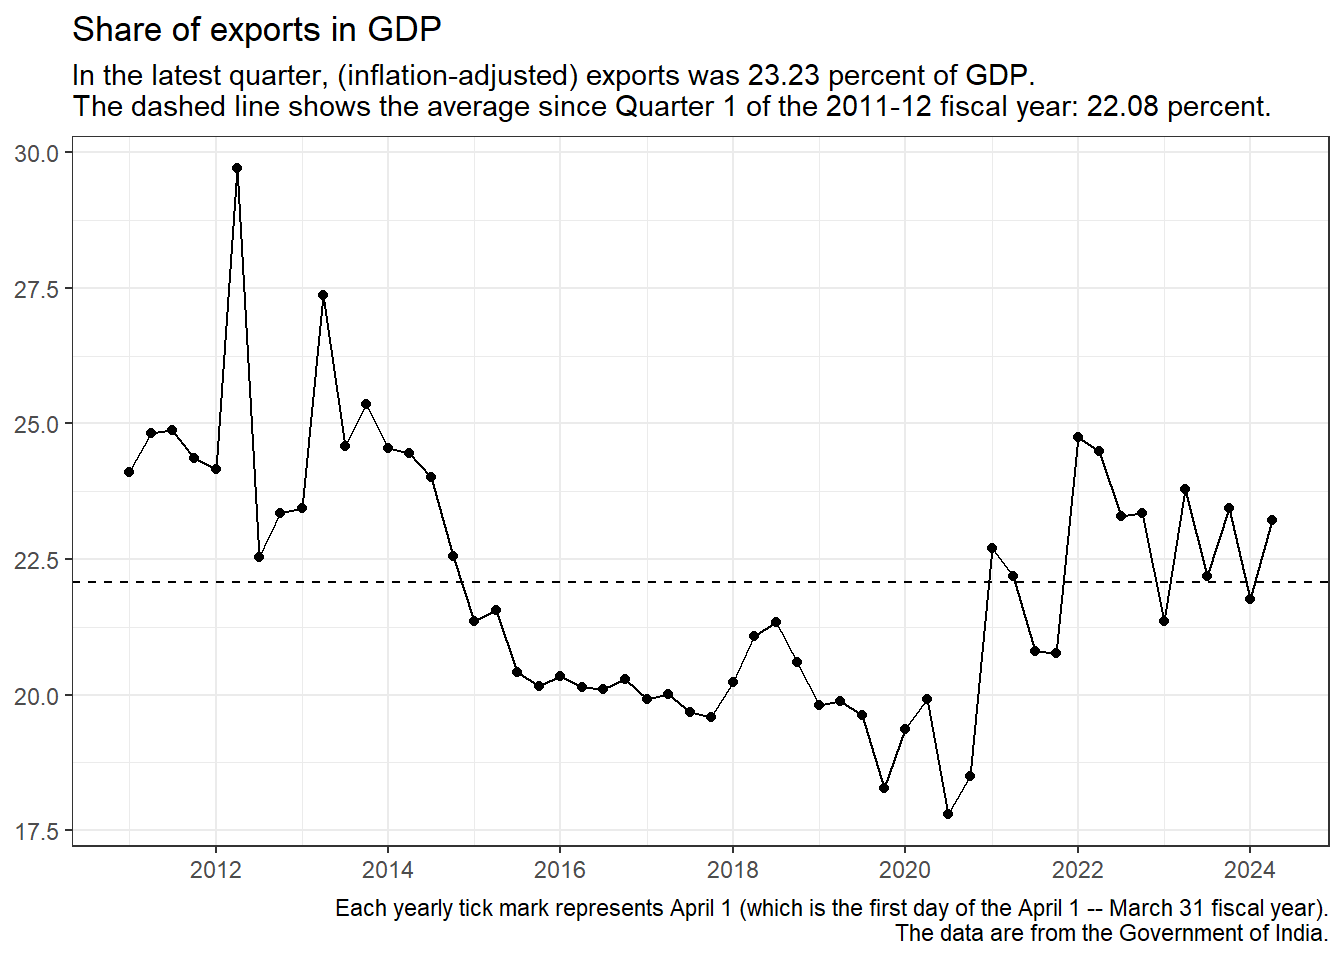
- The second shows that component’s share of total spending (that is, its share of GDP) during each quarter.
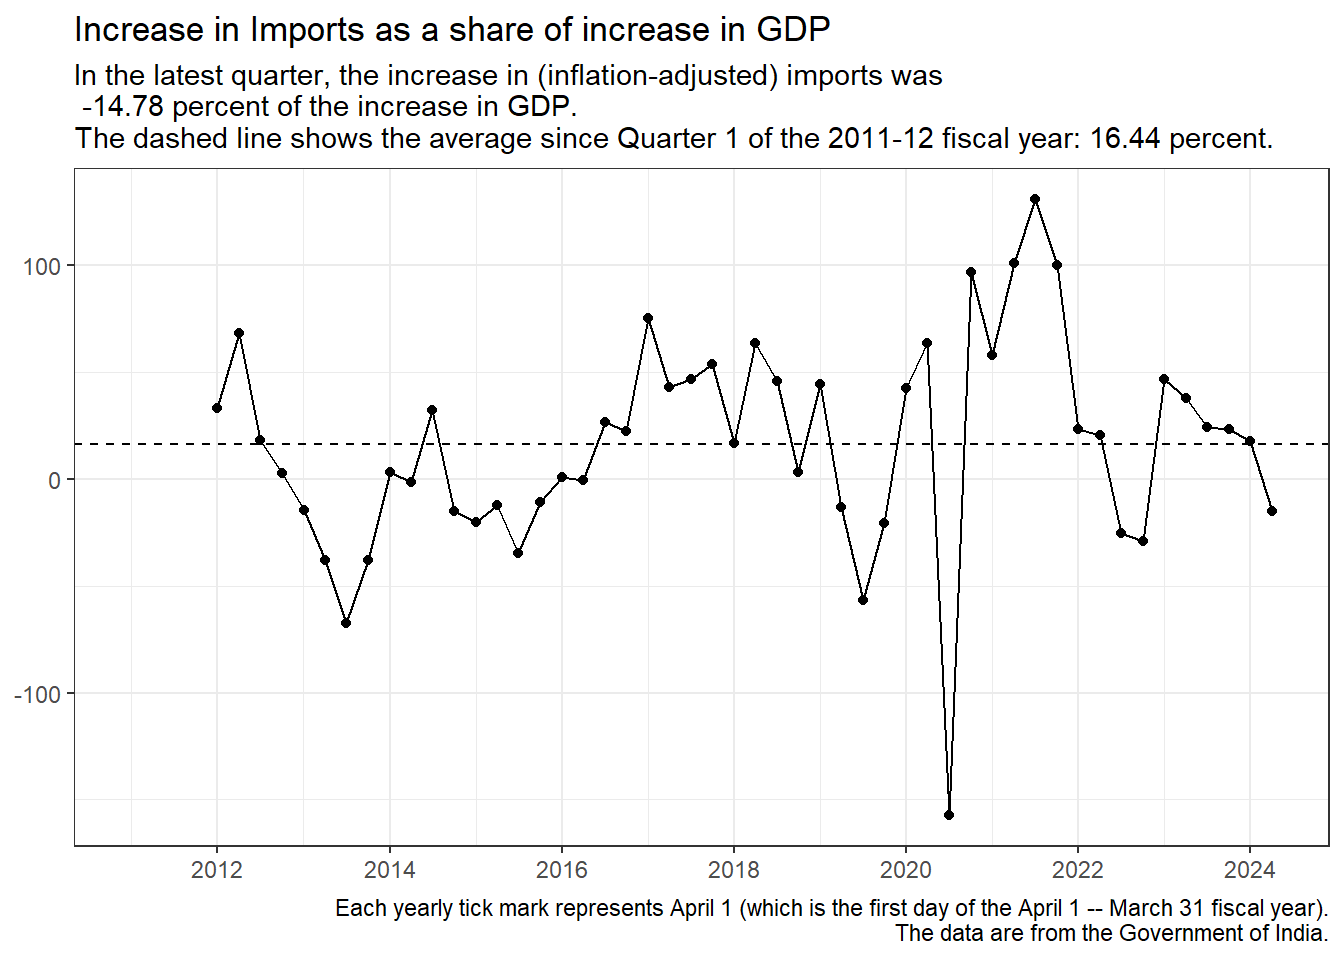
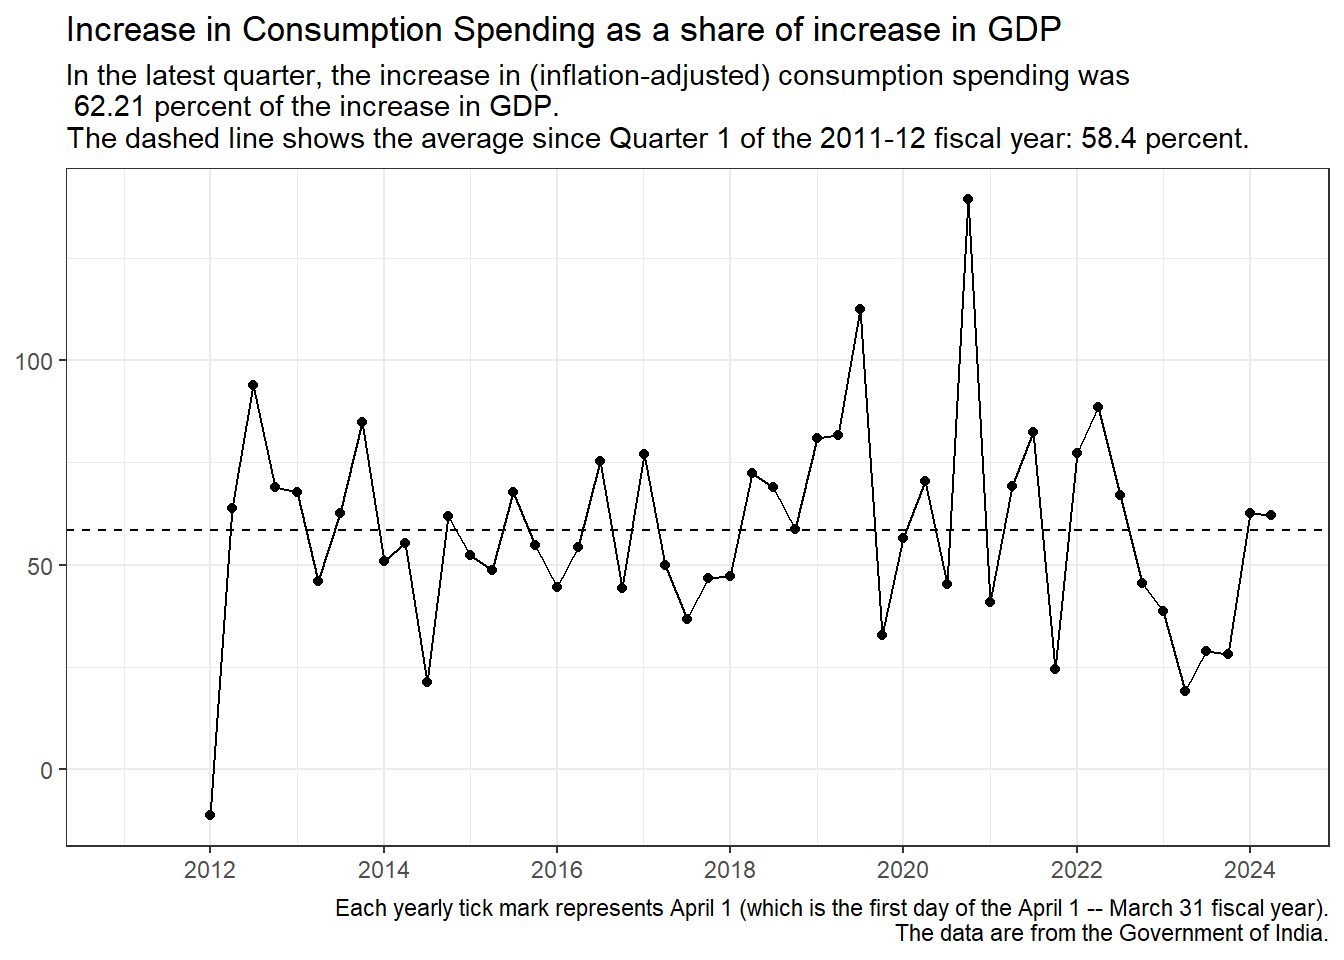
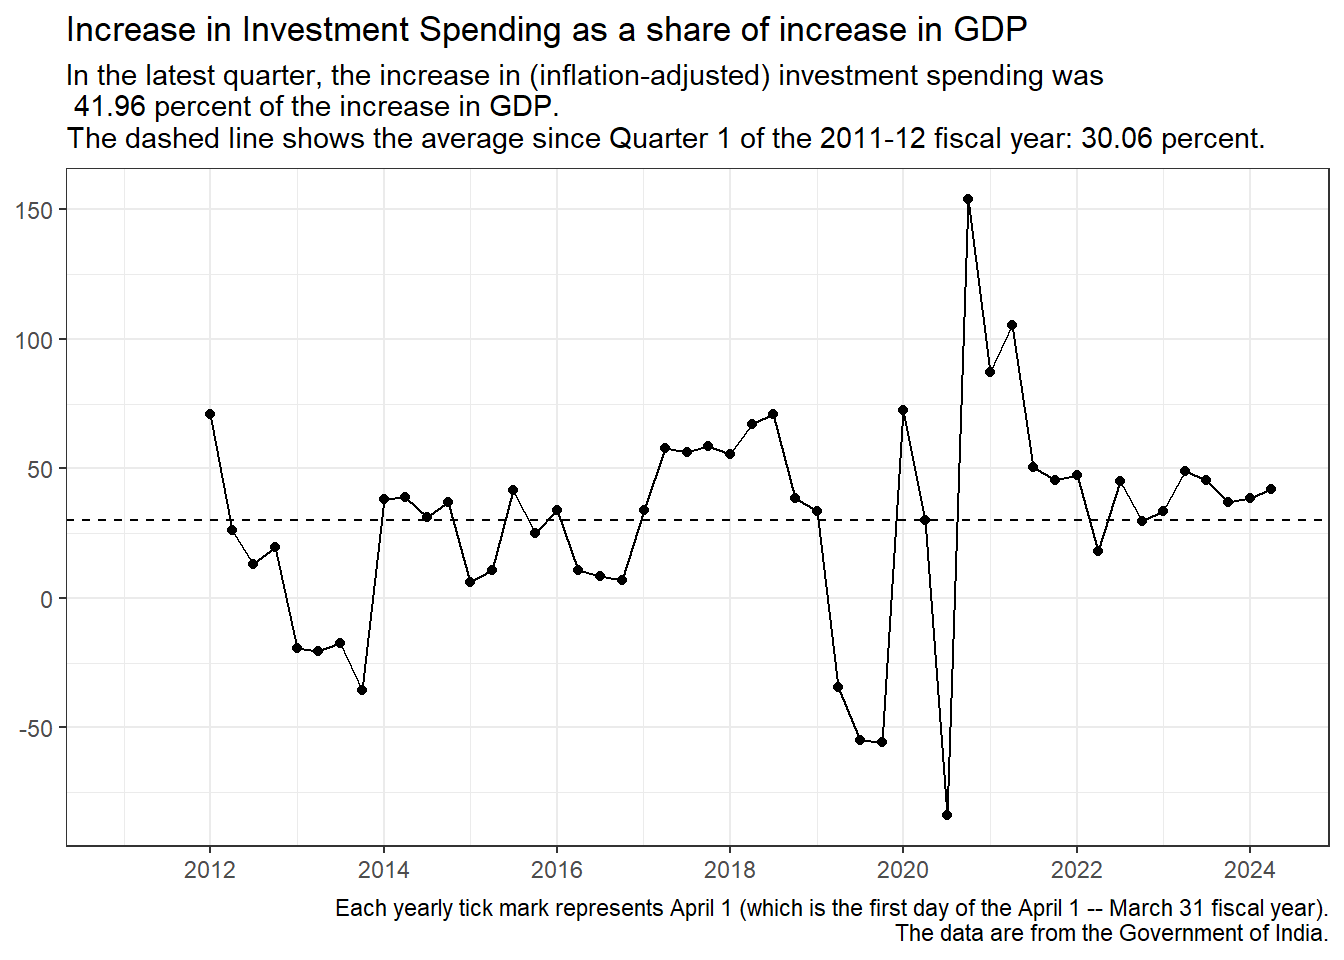
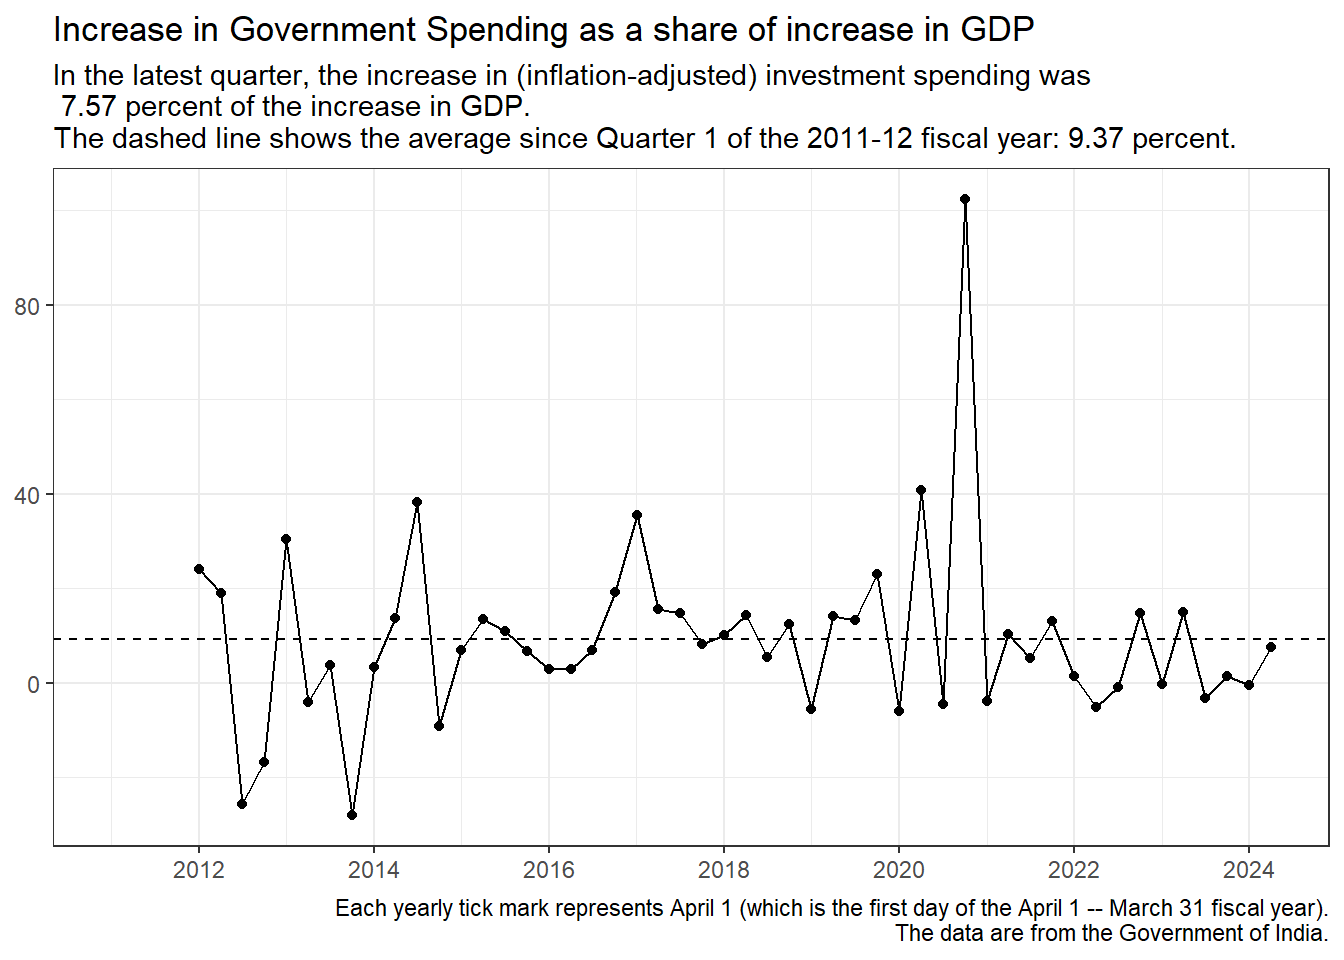
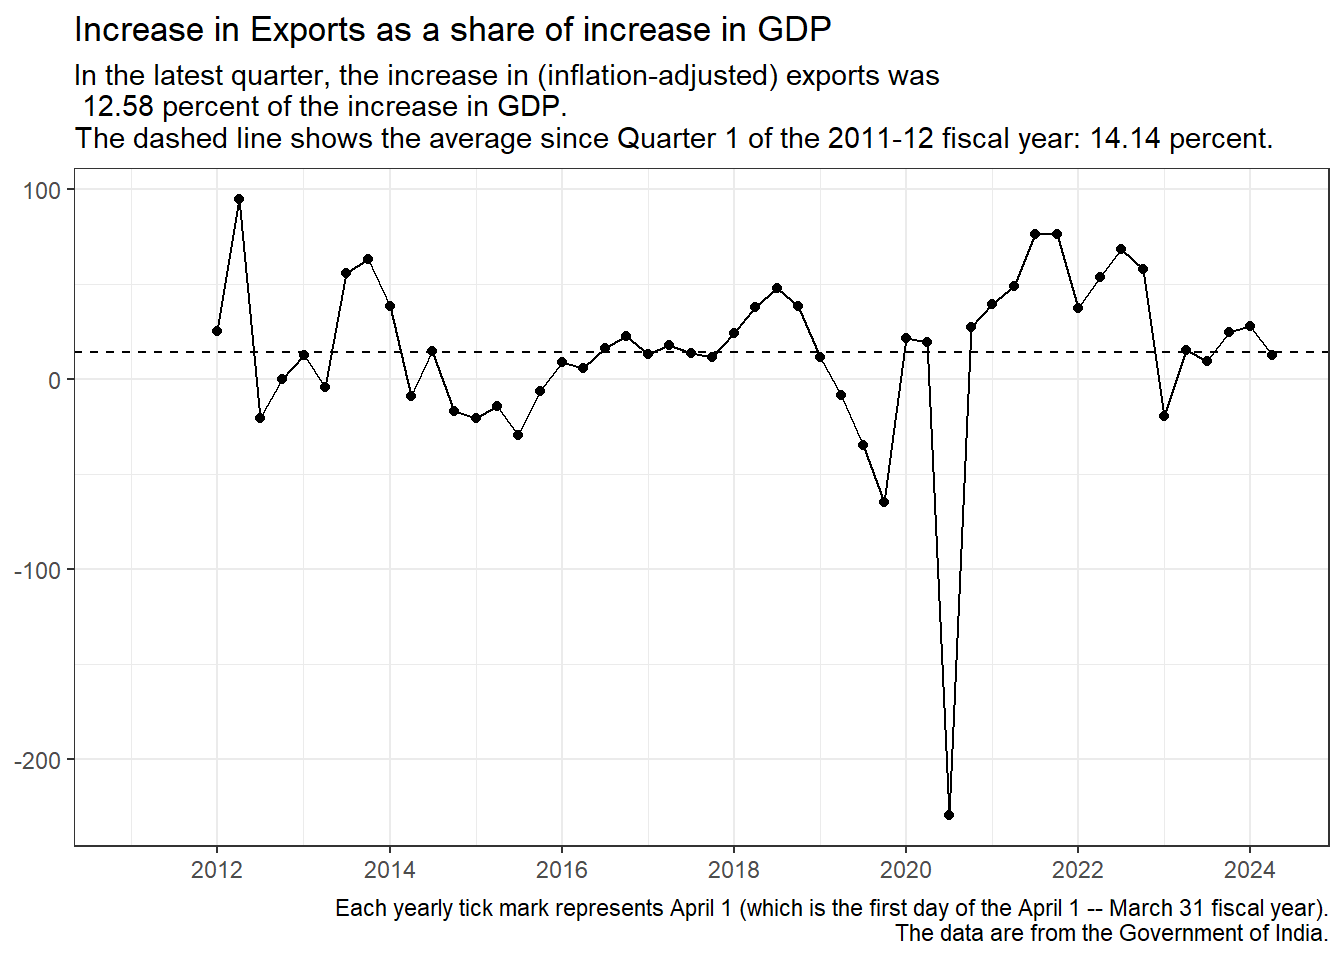
- And the third shows the increase in that component over the previous year as a share of the increase in total spending over the previous year (that is, its increase as a share of the increase in GDP).
Each chart shows the relevant values for each quarter as well as the relevant long-term average from 2011 onwards (shown with a dashed horizontal line).
Consumption Spending
Importance: Consumption spending was 56.28 percent of GDP in the latest quarter (Quarter 2 of the 2024-25 fiscal year). This can be compared with Consumption’s 56.47 percent share of GDP over the full data period (spanning Quarter 1 of the 2011-12 fiscal year through Quarter 2 of the 2024-25 fiscal year).
Investment Spending
Importance: Investment spending was 38.24 percent of GDP in the latest quarter. This can be compared with Investment’s 35.47 percent share of GDP over the full data period.
Government Purchases
Importance: Government Purchases was 9.09 percent of GDP in the latest quarter. This can be compared with Government Purchases’s 10.29 percent share of GDP over the full data period.
Net Exports
Importance: Net Exports was -2.05 percent of GDP in the latest quarter. This can be compared with Net Exports’s -2.99 percent share of GDP over the full data period.
Exports
Importance: Exports was 23.23 percent of GDP in the latest quarter. This can be compared with Exports’s 22.08 percent share of GDP over the full data period.
Imports
Importance: Imports was 25.28 percent of GDP in the latest quarter. This can be compared with Imports’s 25.07 percent share of GDP over the full data period.