The Latest Fiscal Year At A Glance
Data on India’s Gross Domestic Product for the 2024-25 fiscal year has just been published. Here are some highlights:
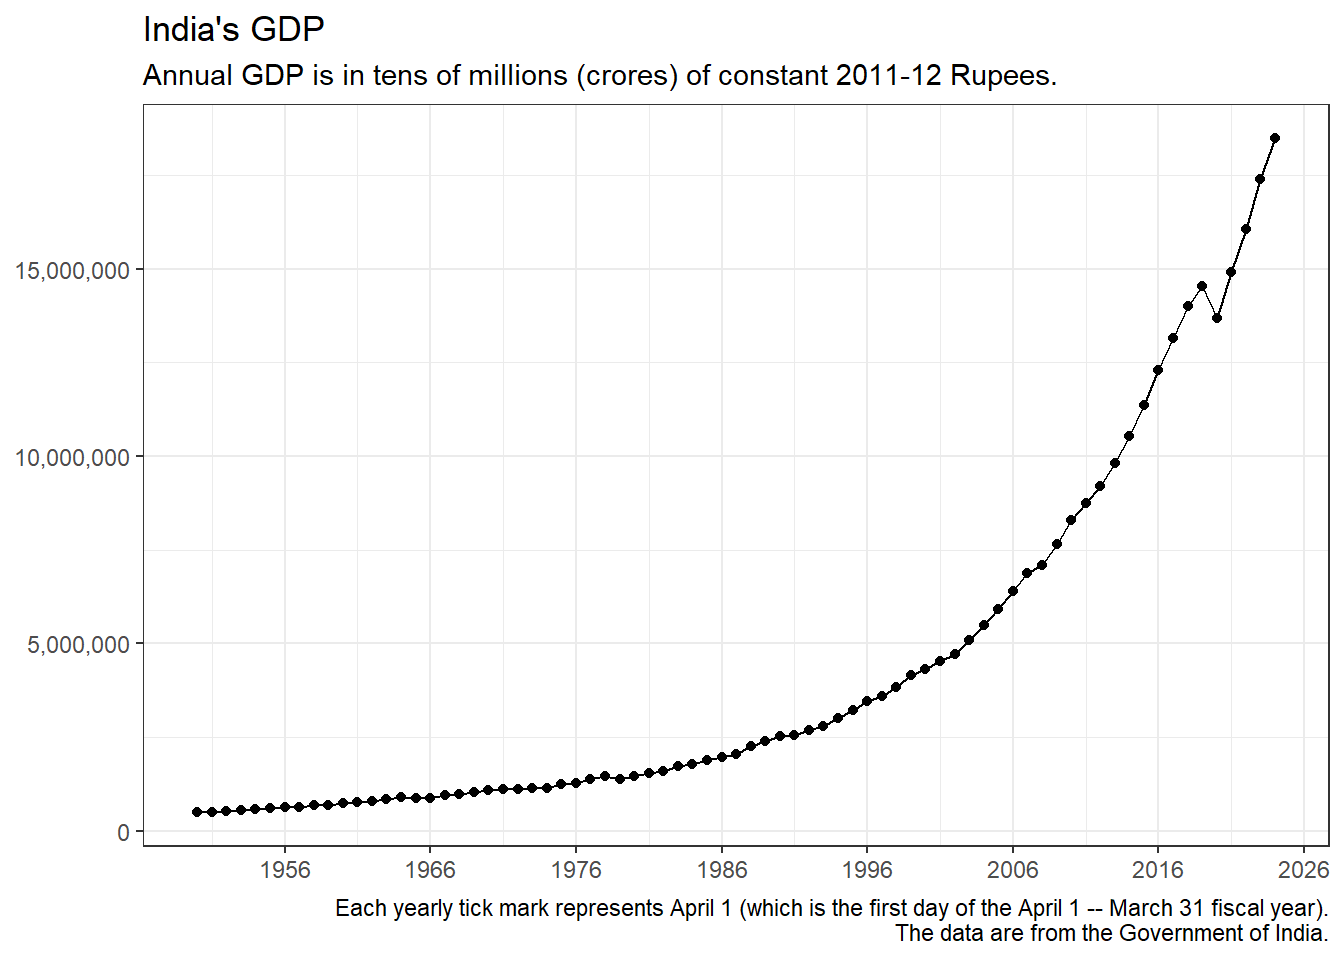
- Inflation-adjusted Gross Domestic Product was INR 18,488,380.91 crores at constant 2011-12 prices. (A crore is ten million or 107.)
- This represents a growth of 6.37 percent compared to the previous fiscal year. (The available data spans the 1950-51 fiscal year through the 2024-25 fiscal year. That’s 74 years. Over the past 74 years, GDP has grown 5.01 percent annually.)
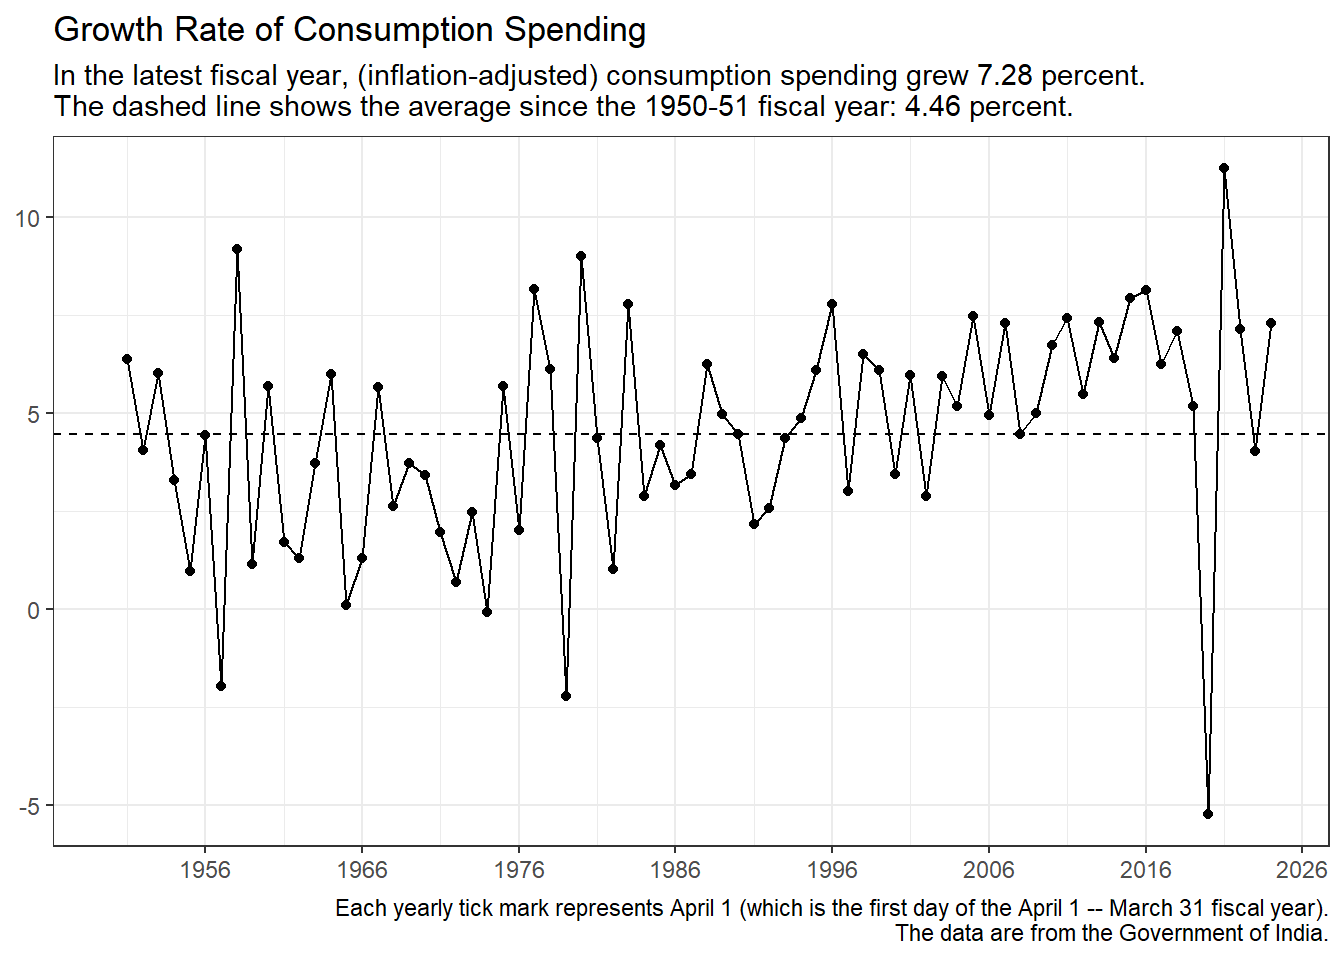
- Consumption spending grew 7.28 percent. (Over the past 74 years, consumption spending has grown 4.46 percent annually.)
- Investment spending grew 6.36 percent. (Over the past 74 years, investment spending has grown 5.96 percent annually.)
- Government purchases grew 4.1 percent. (Over the past 74 years, government purchases has grown 5.73 percent annually.)
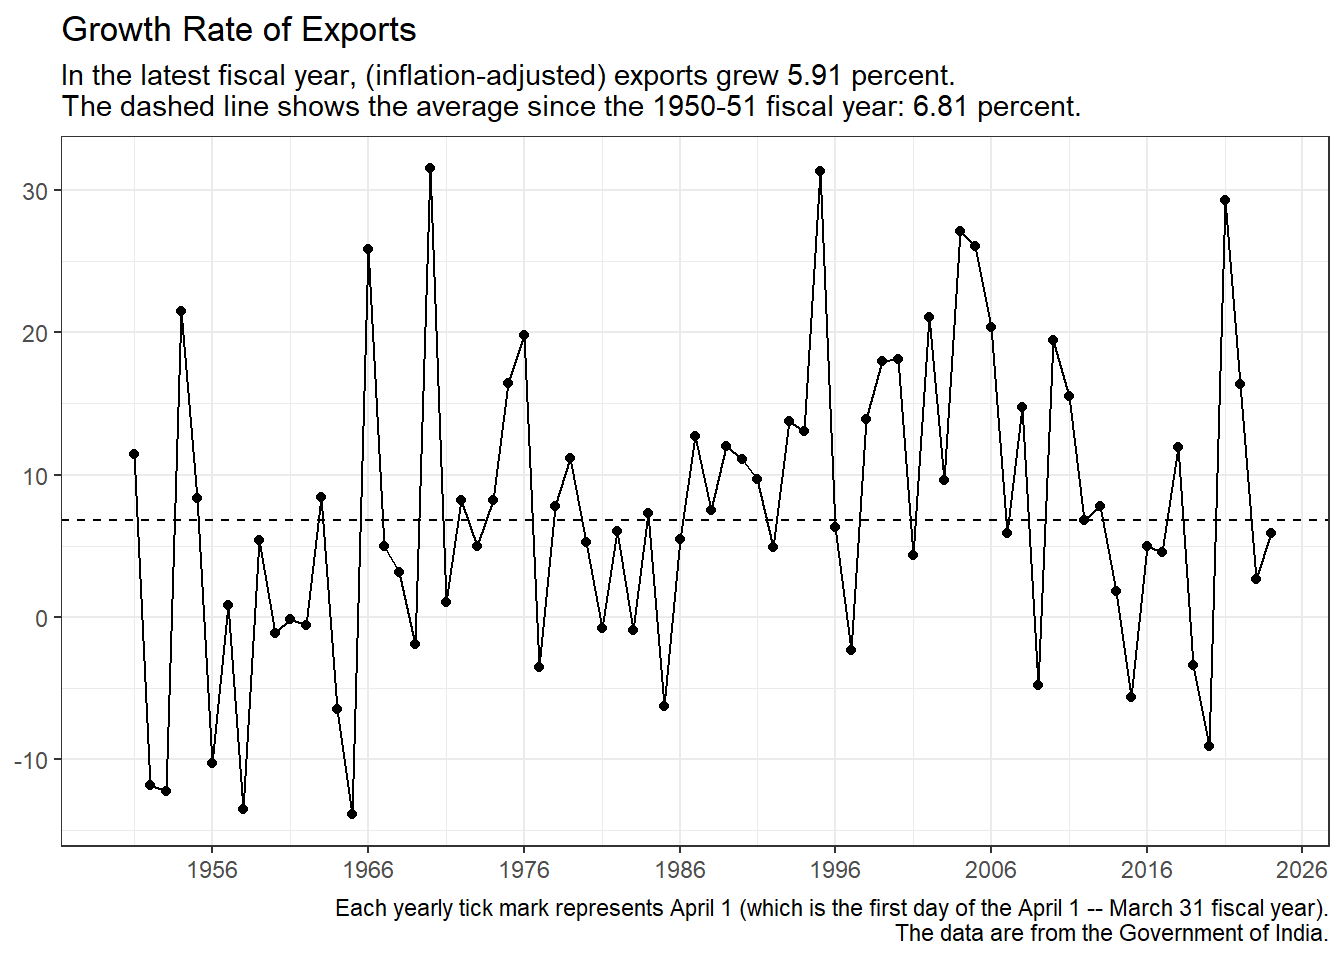
- Exports grew 5.91 percent. (Over the past 74 years, exports has grown 6.81 percent annually.)
- Imports grew -1.31 percent. (Over the past 74 years, imports has grown 6.76 percent annually.)
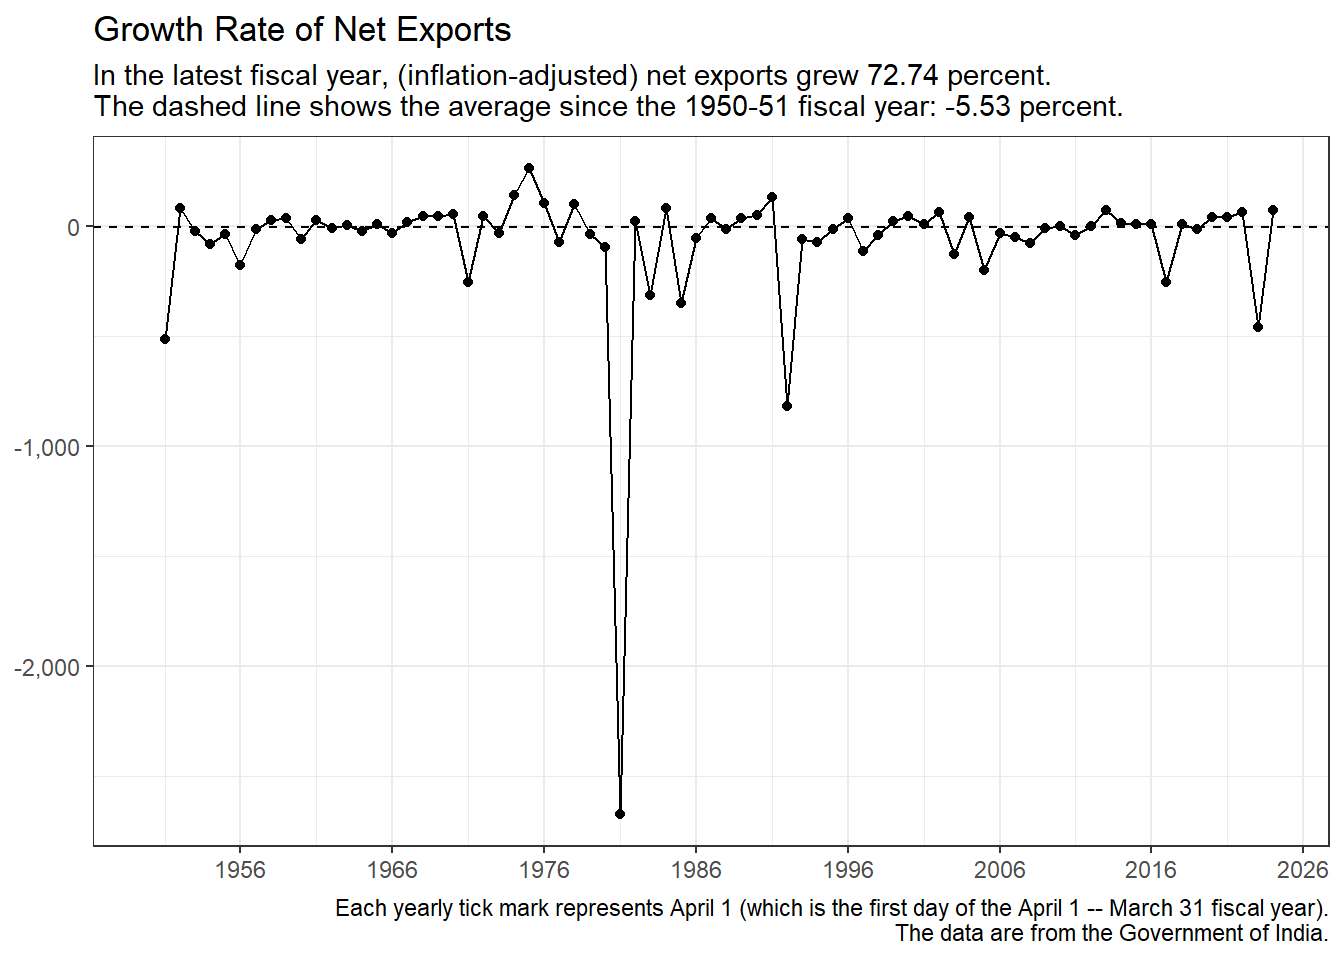
- Net Exports grew 72.74 percent. (Over the past 74 years, net exports has grown -5.53 percent annually.)
- Summary of the latest quarter: Weaker performance than usual. GDP growth was a bit higher than the long-run average, but quite a bit slower than in the last three years. Consumption spending grew nearly twice as fast as the post- Independence average. Investment grew just slightly faster than the post-Independence average.
Gross Domestic Product, Level
Comment: Steady growth. The historic nature of the COVID shock is clear.
Gross Domestic Product, Growth Rate
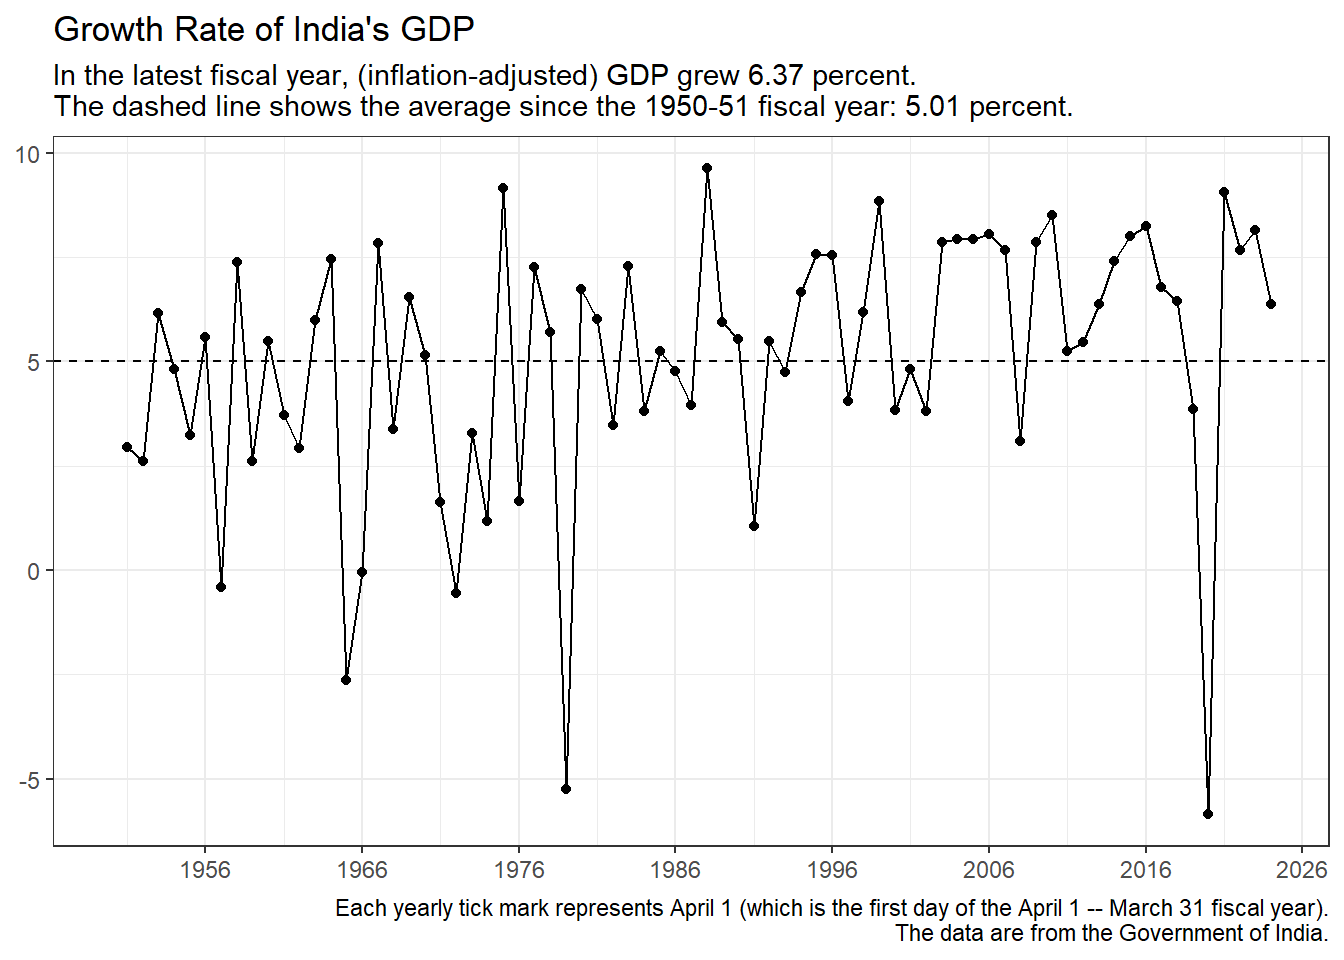
Comment: Note that after 1980 – and most certainly after 1990 – there have been few instances of below-average growth. And barring the COVID shock the downturns have been mild after 1990. The difference between the pre-1990 and post-1990 periods is very clear.
The Components of GDP (C, I, G, and NX)
GDP is the rupee value of all production, roughly speaking. Consequently, GDP is also total income and total spending. Total spending is usually broken down into four components:
- consumption spending (C, which is present oriented),
- investment spending (I, which is future oriented),
- government purchases (G), and
- net exports (NX = Exports - Imports).
Therefore, GDP = C + I + G + NX. It is important to know which kind of spending – that is, which component of GDP – contributes how much to GDP and its growth. Policy makers may be able to design better macroeconomic policies if they can spot the component that is causing trouble.
There are a dozen charts below, three for each of the four components.
- The first of the three charts for a particular component shows that component’s growth rate over the previous year.
- The second shows that component’s share of total spending (that is, its share of GDP) during each fiscal year.
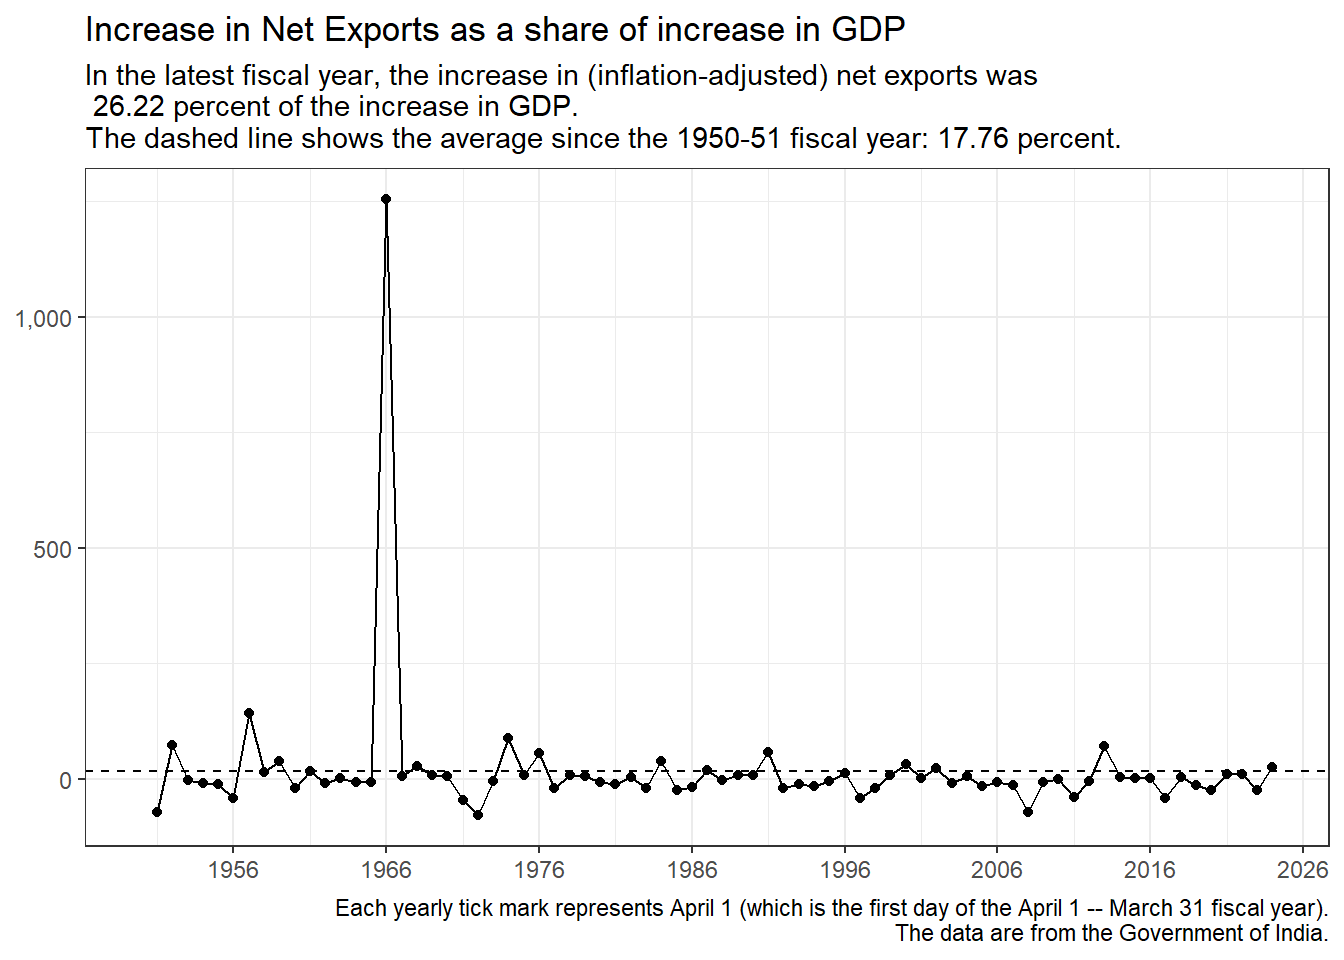
- And the third shows the increase in that component over the previous year as a share of the increase in total spending over the previous year (that is, its increase as a share of the increase in GDP). Caution: I am not quite sure about 1966. That year is a clear outlier and it throws off this third chart for every GDP component. I am aware that India went through a major macroeconomic crisis that year. But I am surprised by the way the third chart for every GDP component gets thrown off in 1966.
Each chart shows the relevant values for each fiscal year as well as the relevant long-term average from 1950-51 onwards (shown with a dashed horizontal line).
Consumption Spending
Importance: Consumption spending was 56.28 percent of GDP in 2024-25, the latest fiscal year. This can be compared with Consumption’s 68.75 percent share of GDP over the full data period (1950-51 through 2024-25).
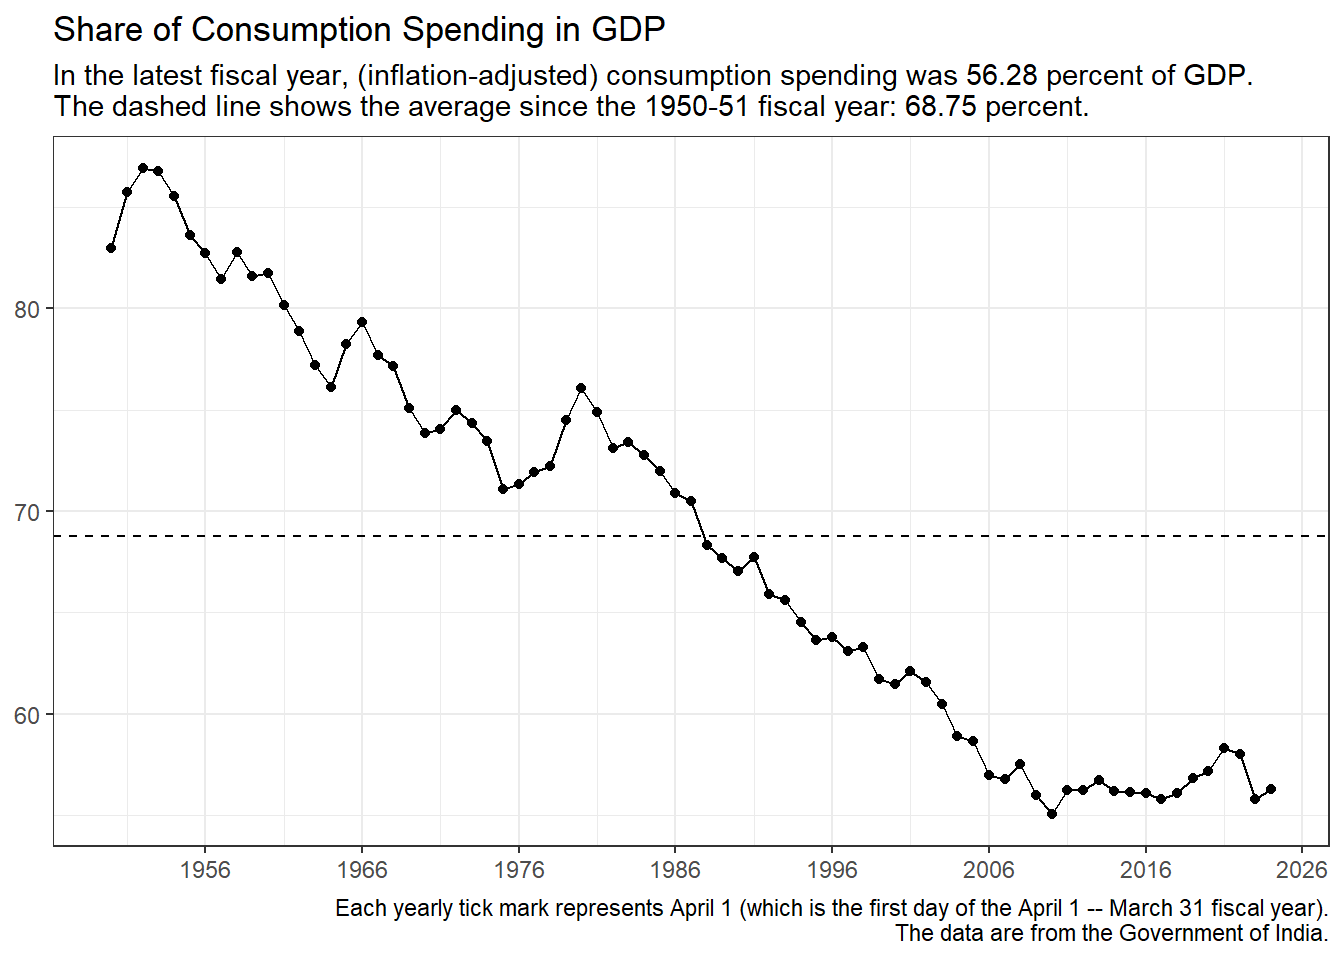
Comment: This is a striking chart and it depicts a big macroeconomic change in India since Independence. Consumption spending has fallen dramatically from approximately 85 percent of GDP in the early 1950s to 55 percent of GDP in recent years. The decline in the share of consumption spending seems to have stabilized over the last two decades.
As can be seen in charts below, the decline in the share of consumption has been matched by increases in Investment and, to a lesser extent, Government Purchases.
Why did these changes occur? Did government policies penalize consumption? Was it caused by an increase in income inequality? (Richer people save more; poorer people spend whatever they earn.)
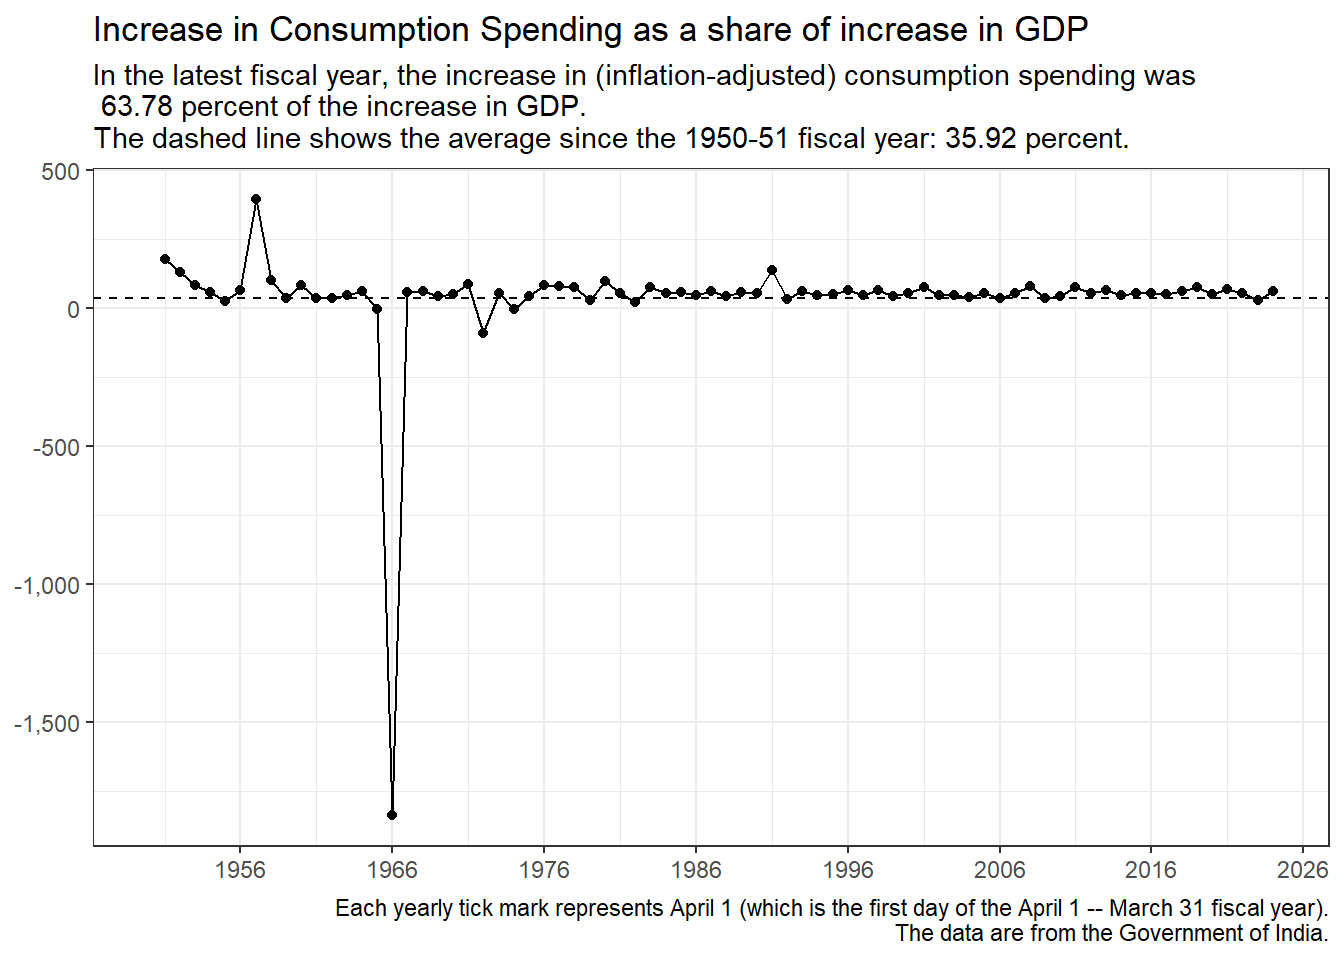
Comment: Something weird about the 1966 data is making this chart look weird.
Investment Spending
Importance: Investment spending was 34.64 percent of GDP in the latest fiscal year. This can be compared with Investment’s 24.25 percent share of GDP over the full data period.
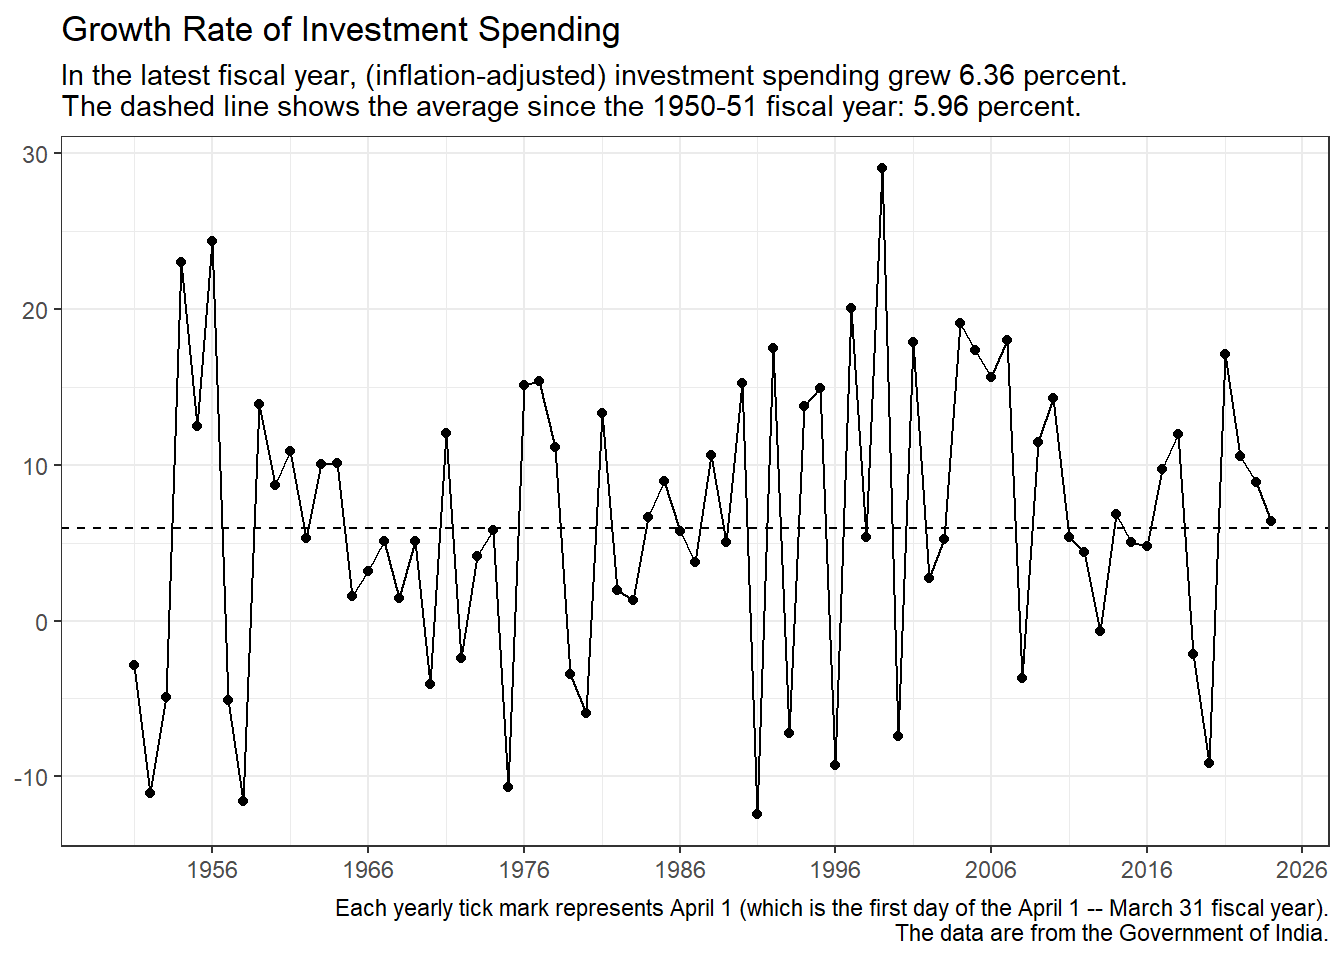
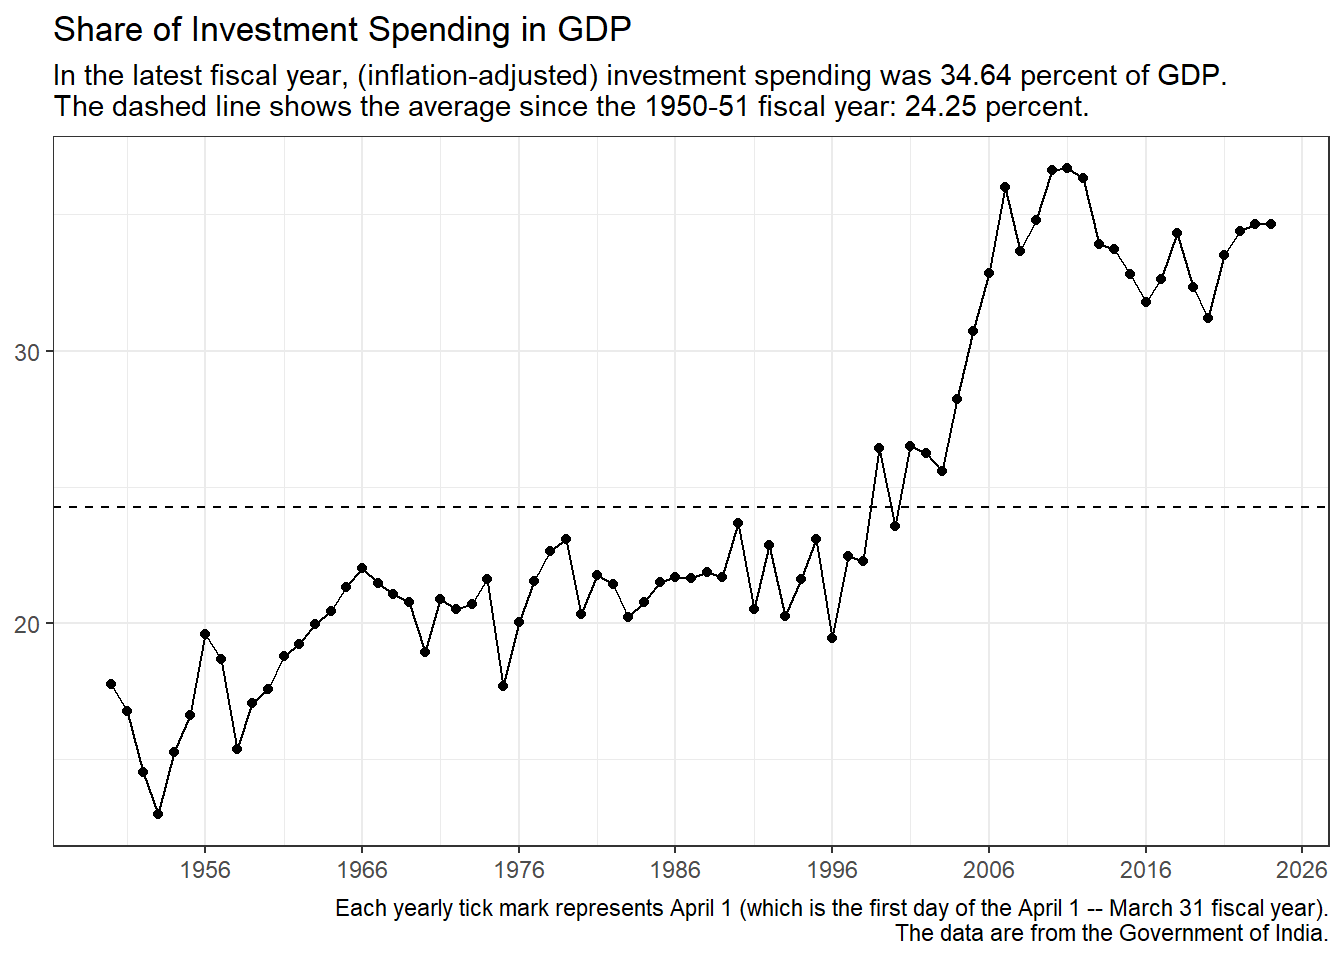
Comment: Note the dramatic increase in Investment as a share of GDP. The decrease in the share of Consumption spending is the other side of this coin.
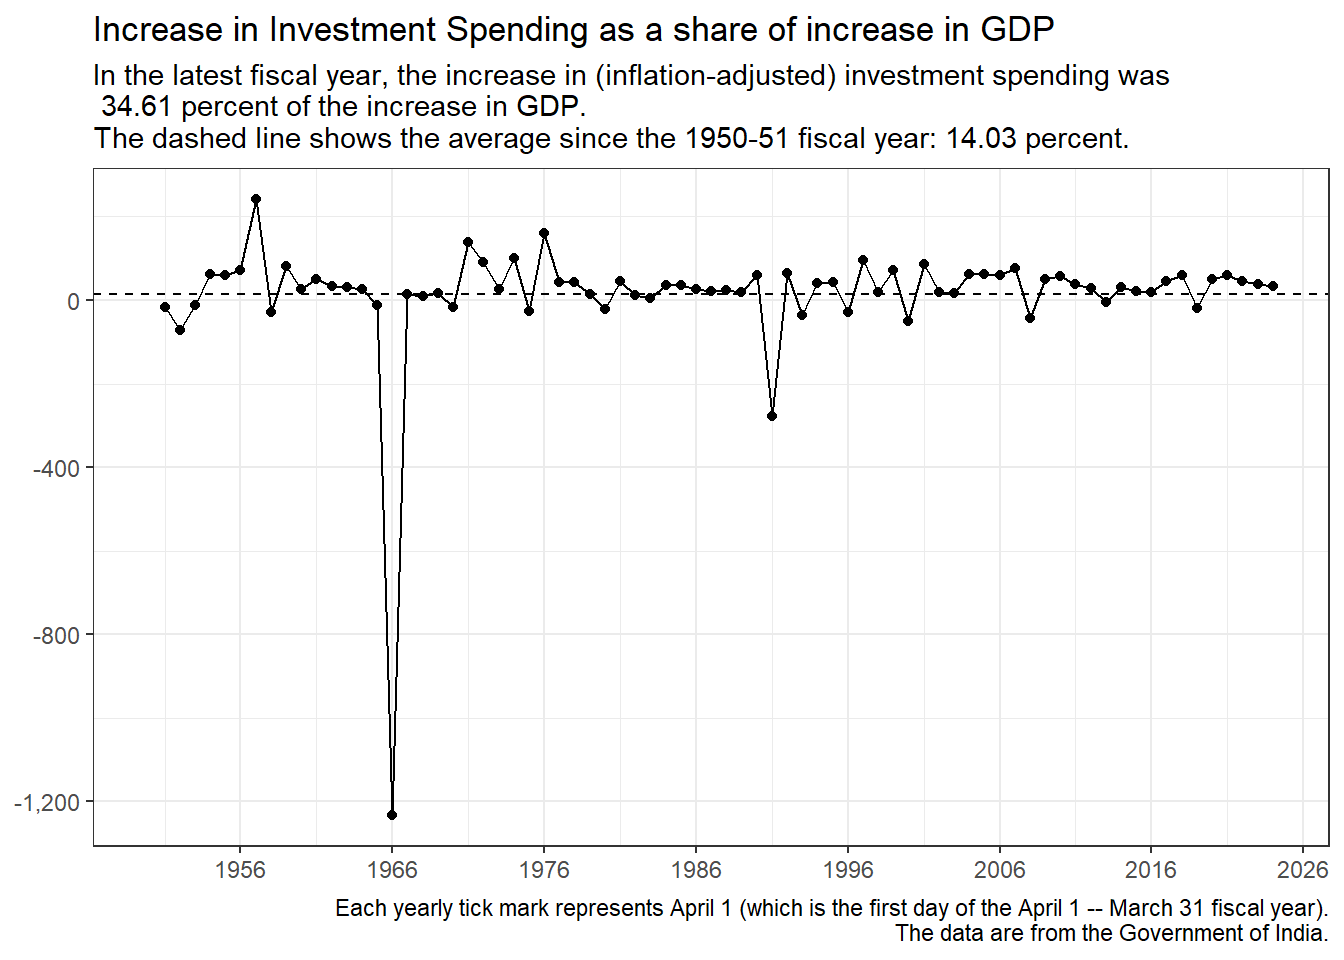
Comment: Something weird about the 1966 data is making this chart look weird.
Government Purchases
Importance: Government Purchases was 9.31 percent of GDP in the latest fiscal year. This can be compared with Government Purchases’s 9.29 percent share of GDP over the full data period.
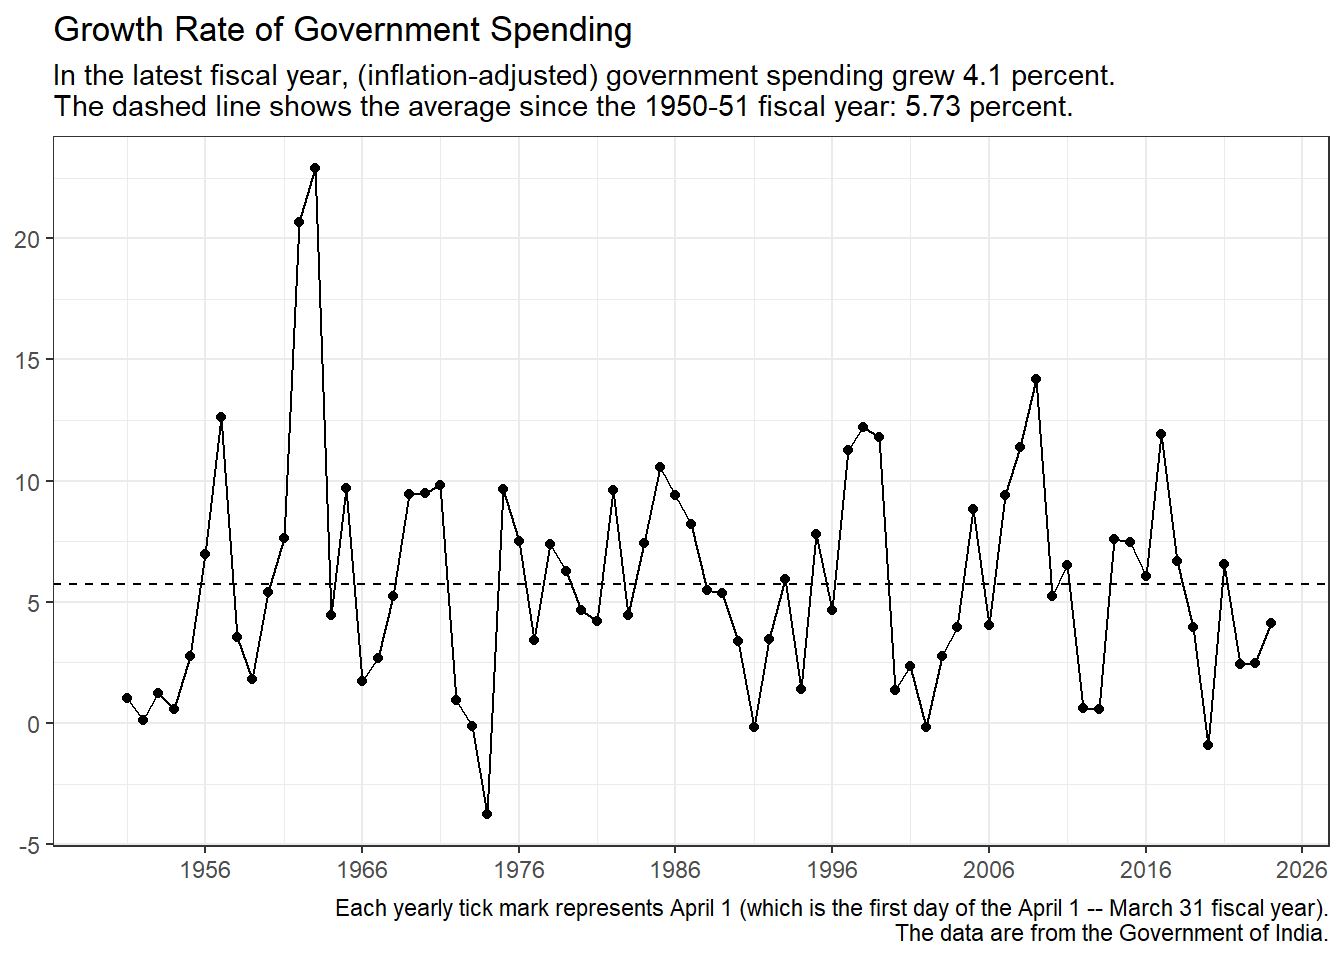
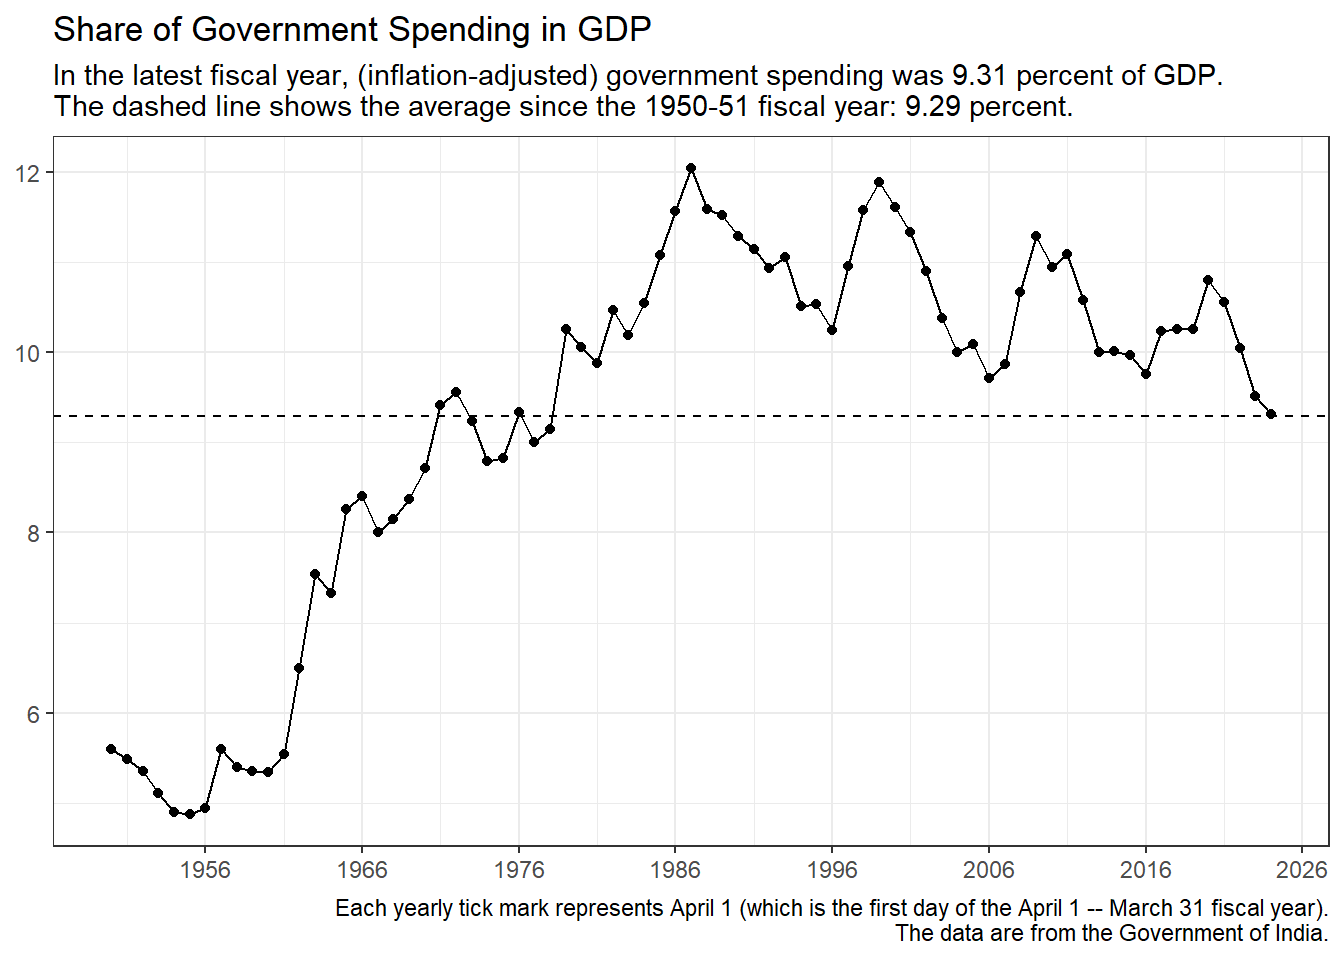
Comment: Note the dramatic increase in Government Purchases as a share of GDP between 1950-51 and 1986-87. The decrease in the share of Consumption spending is the other side of this coin. Since 1986-87, government purchases has stayed within bounds.
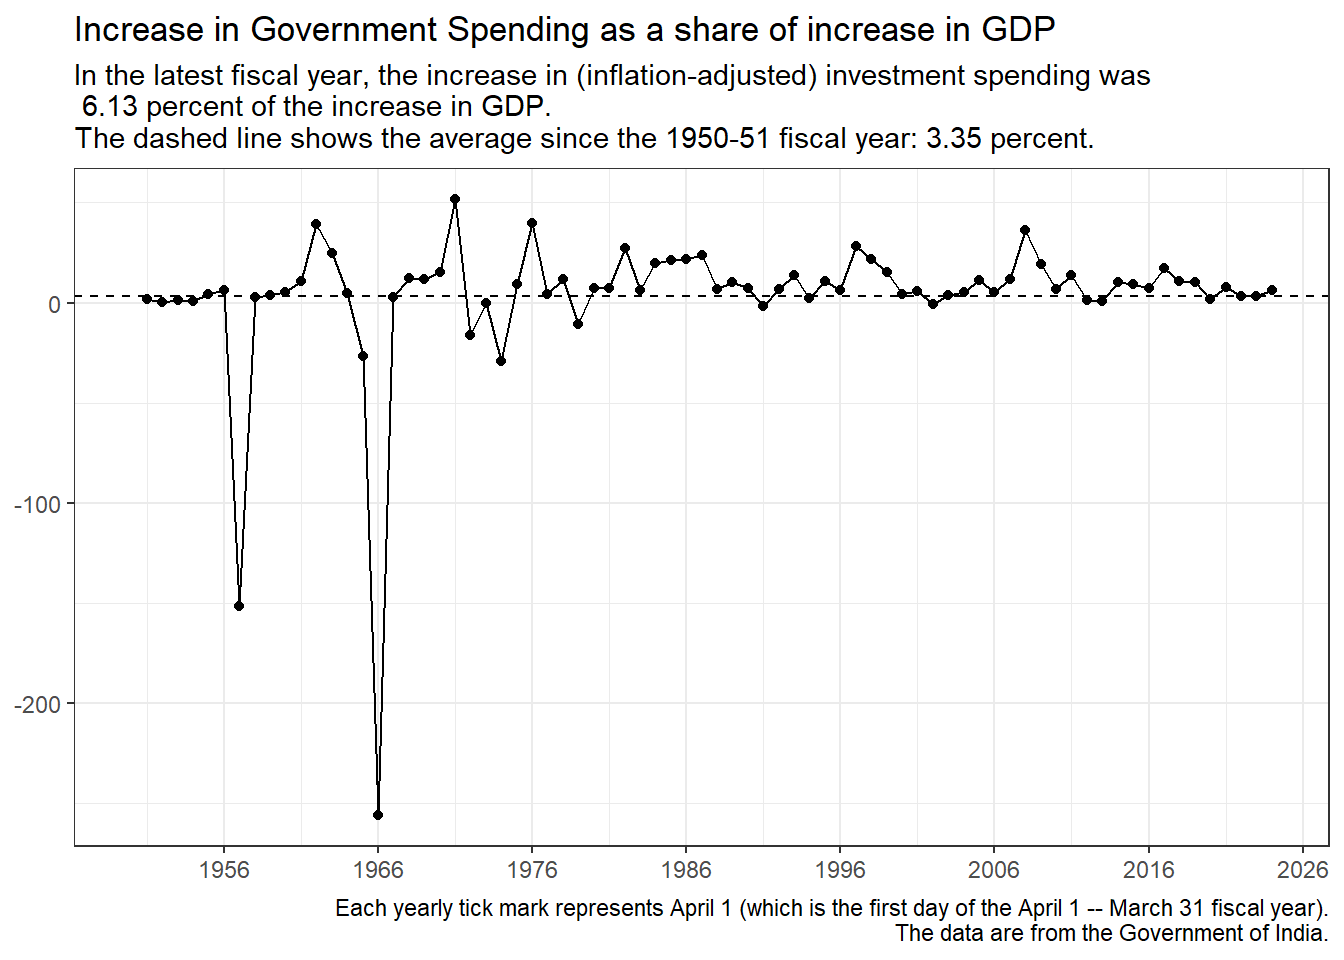
Comment: Again, something weird about the 1966 data is making this chart look weird.
Net Exports
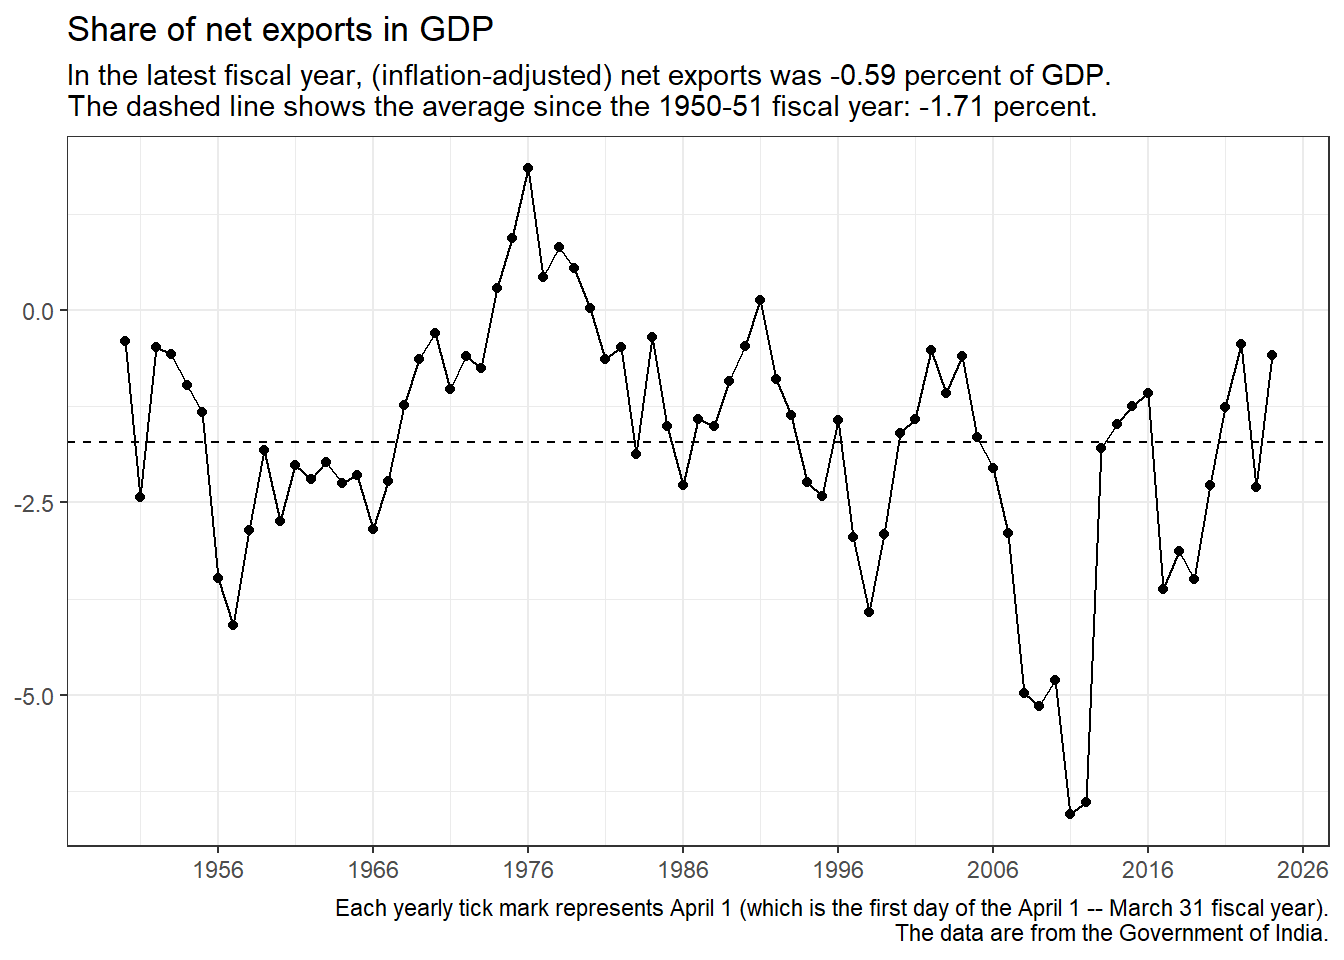
Importance: Net Exports was -0.59 percent of GDP in the latest fiscal year. This can be compared with Net Exports’s -1.71 percent share of GDP over the full data period.
Exports
Importance: Exports was 22.62 percent of GDP in the latest fiscal year. This can be compared with Exports’s 10.44 percent share of GDP over the full data period.
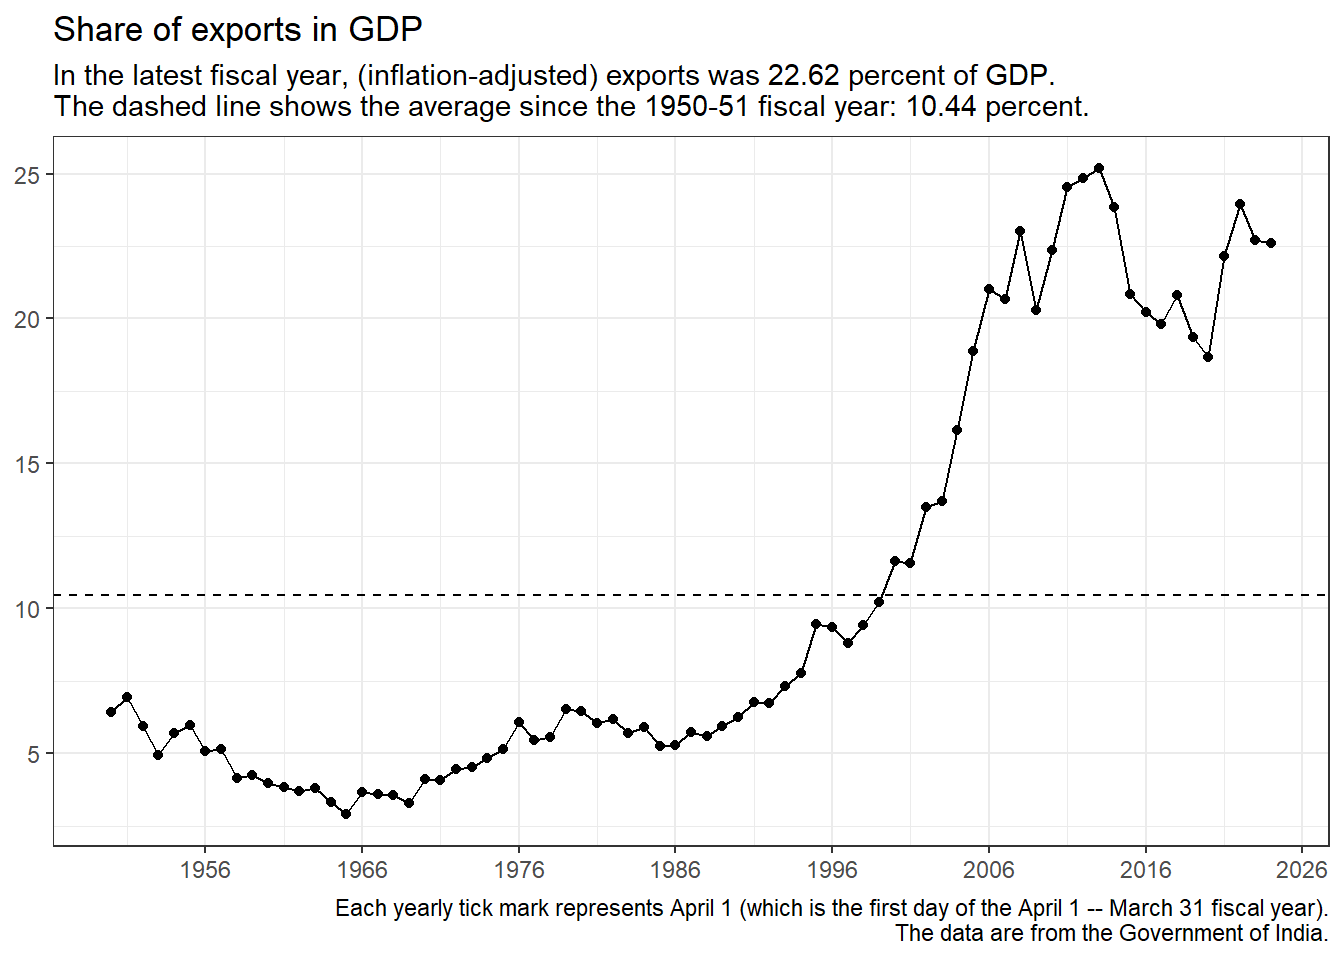
Comment: Here we see another major macroeconomic change in post-Independence India. Globalization!
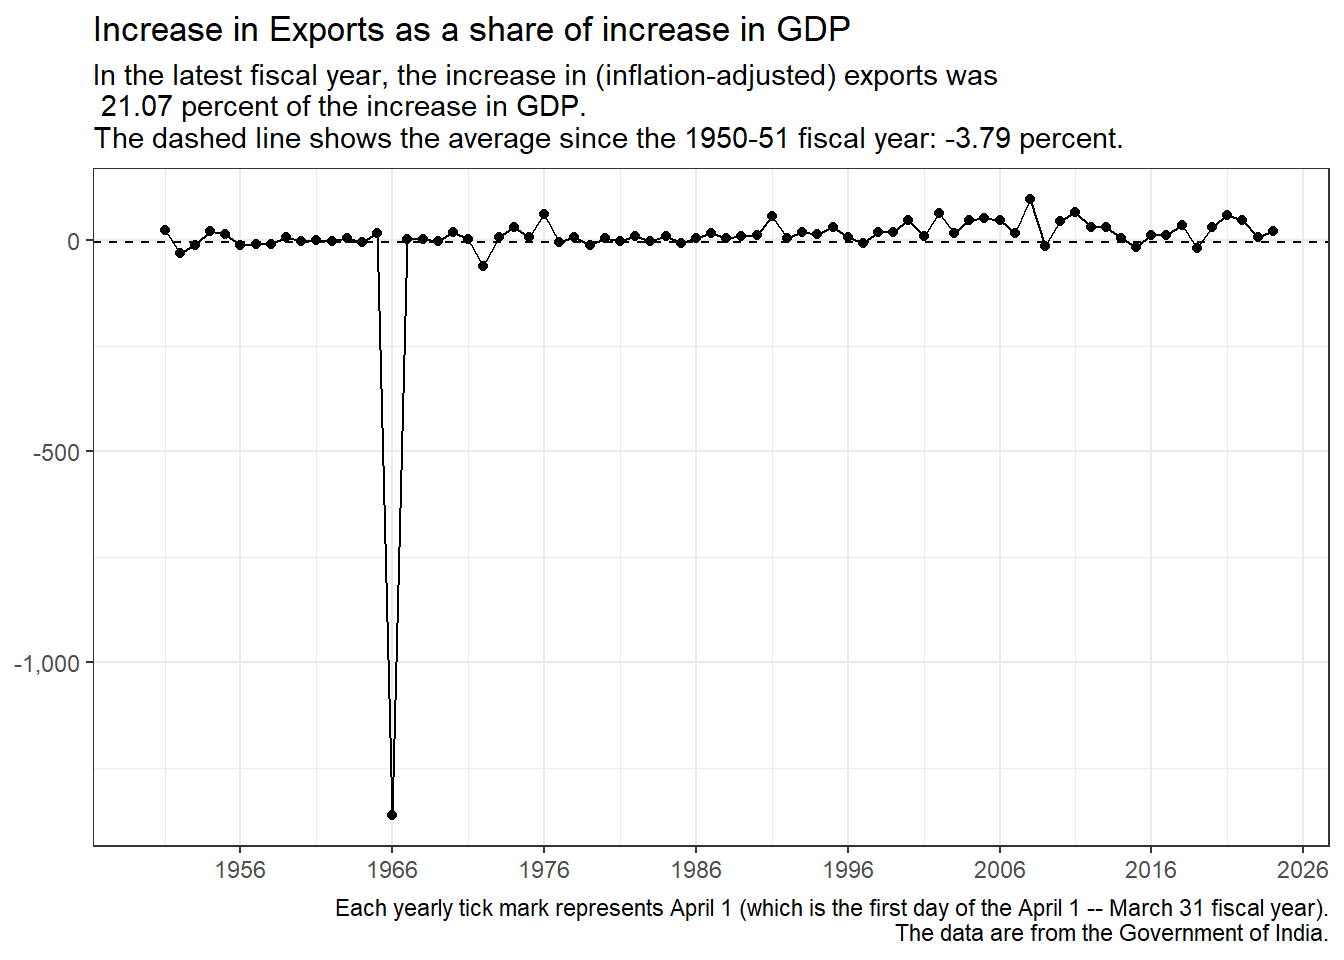
Comment: Again, something weird about the 1966 data is making this chart look weird. What happened??
Imports
Importance: Imports was 23.21 percent of GDP in the latest fiscal year. This can be compared with Imports’s 12.15 percent share of GDP over the full data period.
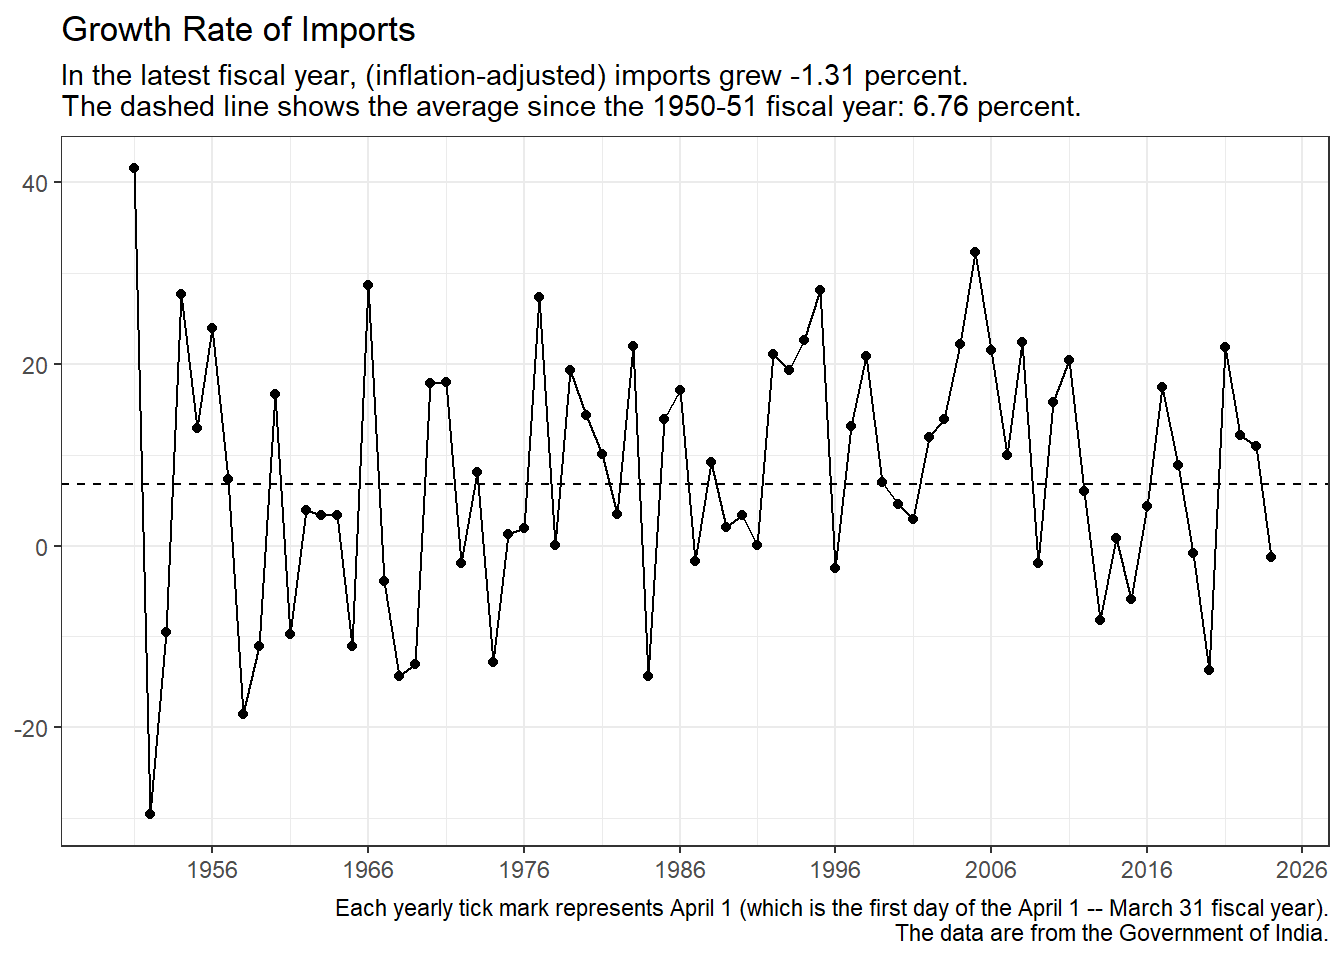
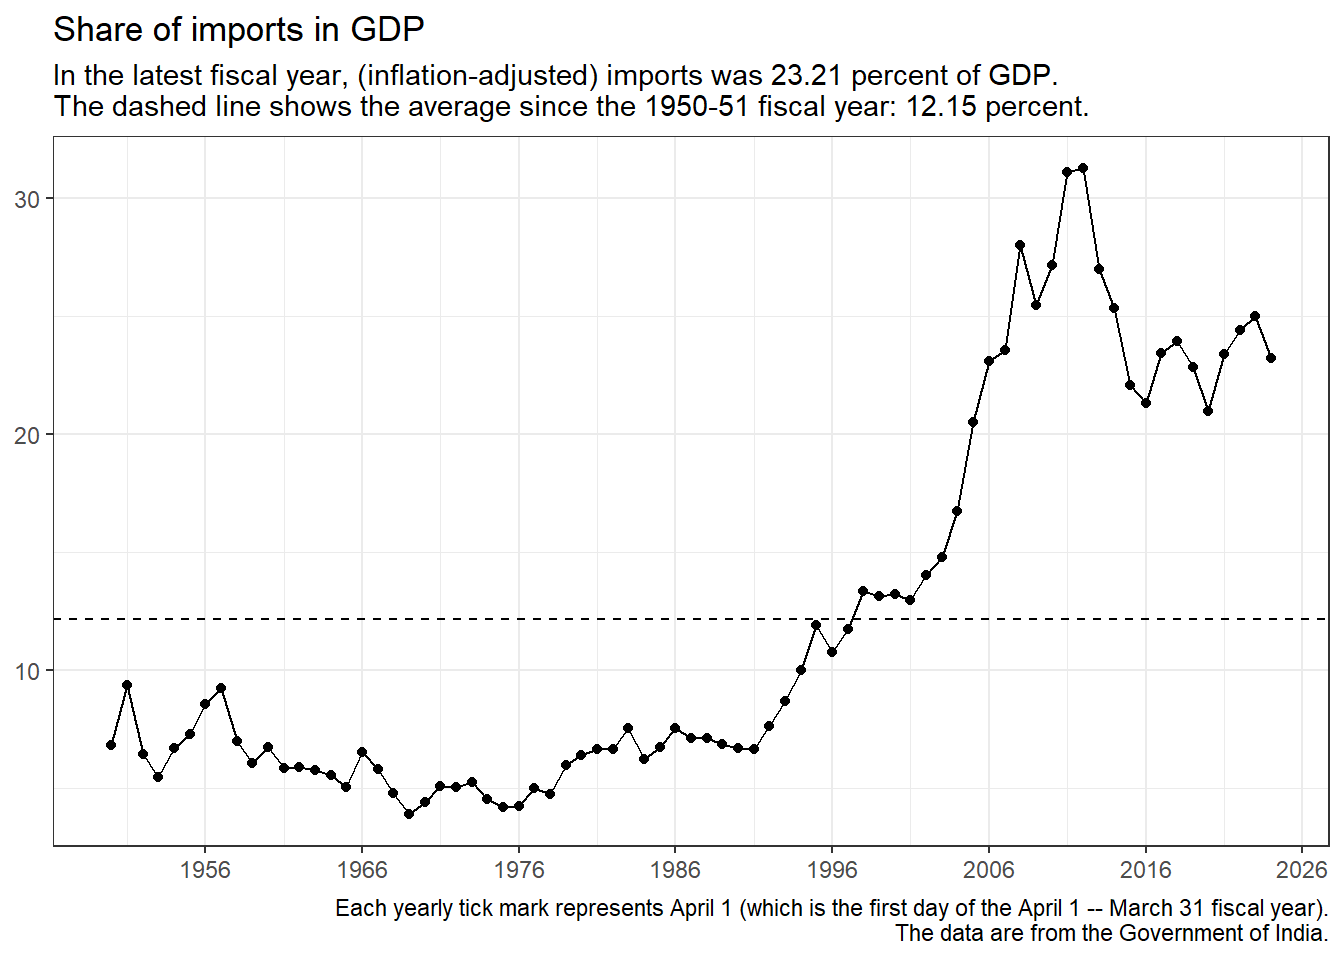
Comment: As was the case for the Exports chart, here we see again the major macroeconomic change that globalization brought to post-Independence India.
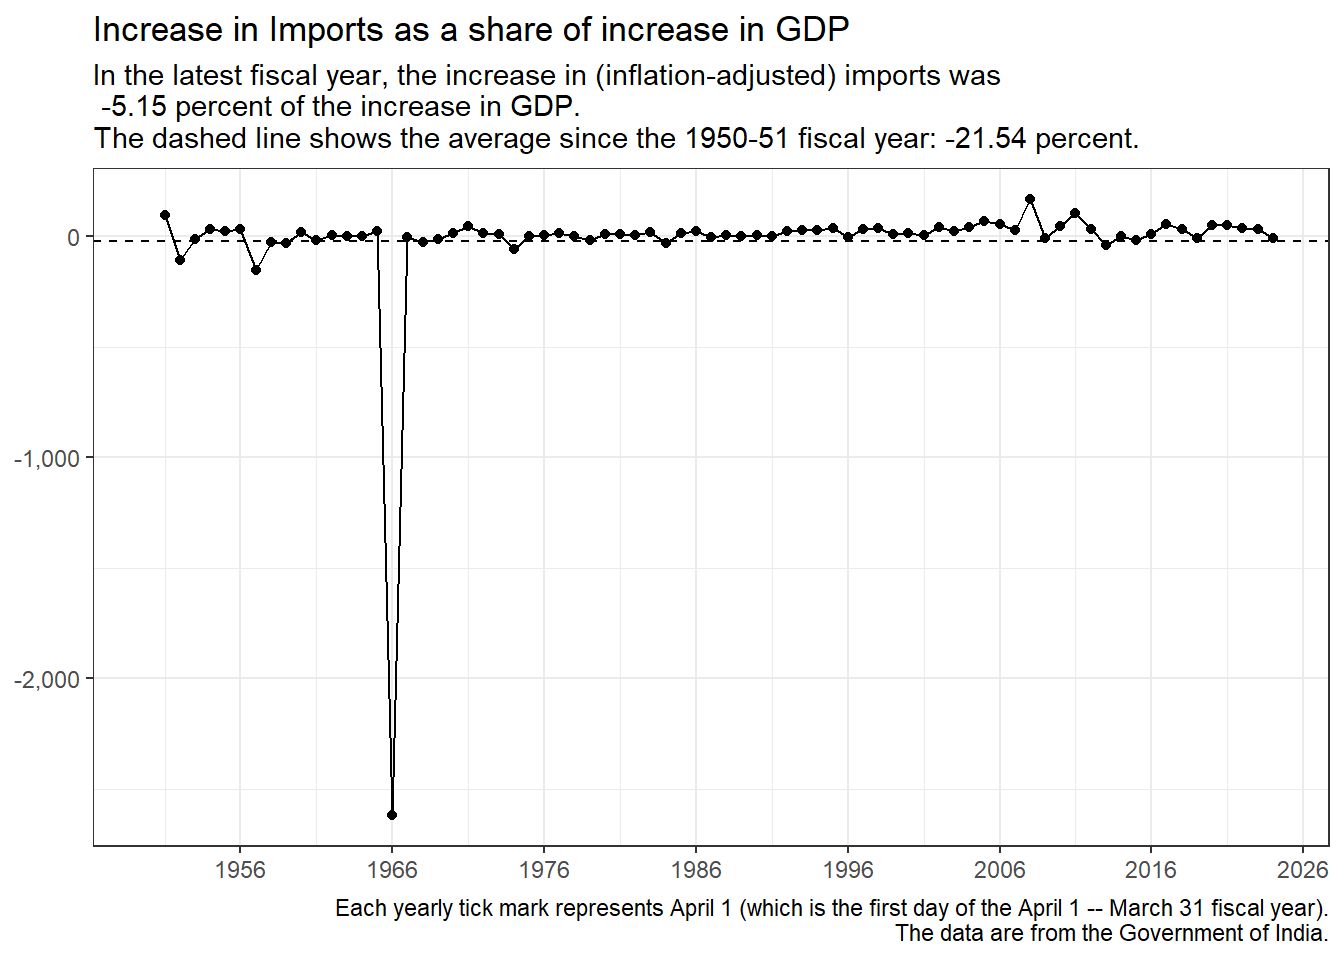
Comment: As was the case for all the other components of GDP, something weird about the 1966 data is making this chart look weird. What happened??