Chapter 3 Measuring the Cost of Living
- What’s the cost of living the way we actually live? That is, what’s the cost of buying the things we buy?
- Why do we need to measure the cost of living?
3.1 The Consumer Price Index
The Consumer Price Index (CPI) is a measure of the overall cost of the goods and services bought by a typical consumer. So, it is a measure of the cost of living.
Here’s CPI data for the United States: https://www.bls.gov/news.release/cpi.toc.htm. The Bureau of Labor Statistics reports its measure of the CPI every month. Here’s another source for the same data: http://research.stlouisfed.org/fred2/series/CPIAUCSL.
Changes in the CPI are used to monitor changes in the cost of living over time. When the CPI rises, the typical family has to spend more money to maintain the same standard of living.
3.2 How the CPI Is Calculated
- Fix the Typical Consumer’s Basket (TCB): figure out what’s in the “basket” of goods and services that the typical consumer buys.
- Find the prices paid by the typical consumer for the goods in the TCB.
- Compute the TCB’s market value in all years.
- Choose a Base Year and compute the CPI for all years, using Equation (3.1) below.
- Compute the inflation rates for all years, using Equation (3.2) below.
3.2.1 How the CPI Is Calculated: Fix the Typical Consumer’s Basket (TCB)
We need to determine what “basket” of goods and services that the typical consumer buys.
The Bureau of Labor Statistics (BLS) conducts a survey and determines the TCB.
3.2.2 How the CPI Is Calculated: Find the Prices
The BLS conducts monthly consumer surveys to also determine the prices of the goods and services in the TCB. We need to find the prices of each of the goods and services in the typical consumer’s basket for each year.
3.2.3 How the CPI Is Calculated: Compute the Basket’s Market Value
Use the data on prices to calculate the market value of the typical consumer’s basket for each year.
3.2.4 How the CPI Is Calculated: Choose a Base Year and Compute the CPI
Designate a particular year as the base year, making it the benchmark year against which other years are compared.
Compute the CPI for any given year as follows:
- Divide the market value of the typical consumer’s basket in the given year by its market value in the base year.
- Then, multiply the result by 100.
\[\begin{equation} \textrm{CPI for 2018 with Base Year 2009}\equiv\frac{\textrm{Market Value of TCB in 2018 prices}}{\textrm{Market Value of TCB in 2009 prices}}\times 100 \tag{3.1} \end{equation}\]
3.2.5 How the CPI Is Calculated: Compute the inflation rate
The inflation rate for a given year is the percentage increase in the CPI from the preceding period.
Equation (3.2) defines the inflation rate:
\[\begin{equation} \textrm{Inflation Rate in 2018, Base Year 2009}\equiv\frac{\textrm{CPI for 2018, Base Year 2009} - \textrm{CPI for 2017, Base Year 2009}}{\textrm{CPI for 2017, Base Year 2009}}\times 100 \tag{3.2} \end{equation}\]
Note that the inflation rate could be negative, if CPI decreases over time.
3.2.5.1 How the CPI Is Calculated: Example
- Suppose the Base Year is 2020
- Suppose the market value of the Typical Consumer’s Basket of goods and services (TCB) is $1,200 in 2020 prices
- Suppose the market value of the same TCB is $1,236 in 2022 prices
- Then CPI for 2022, Base Year 2020 = $1,236 ÷ $1,200 × 100 = 103
- Meaning that, on average, prices increased 3 percent between 2020 and 2022
3.2.5.2 How the CPI Is Calculated: The Basic Idea
Let’s look at the above example again.
Suppose you went to Hawaii on holiday in 2020 and spent $1,200. Suppose you went to Hawaii again in 2022, and paid for exactly the same goods and services as in 2020: the same hotel room, the same meals, the same travel, the same everything. And yet, you find that you spent $1,236 during your 2022 holiday.
Now, $1,236 ÷ $1,200 = 1.03, meaning that your 2022 spending was 1.03 times your 2020 spending, even though you paid for exactly the same things on both holidays.
How could that be? The only plausible explanation is that prices in 2022 were—on average—a multiple of 1.03 of the prices in 2020. That is, prices in 2022 were 103 percent of the prices in 2020, on average. Or, equivalently, prices in Hawaii were 3 percent higher in 2022 compared to 2020.
In this way, by comparing the market value of a fixed basket of goods at two different dates, one can estimate the overall percentage change in prices between those two dates. This is the basic idea behind the CPI formula in Equation (3.1).
3.2.5.3 How the CPI Is Calculated: Another Example
Figure 3.1 presents yet another worked out example of the calculation of the CPI and inflation.
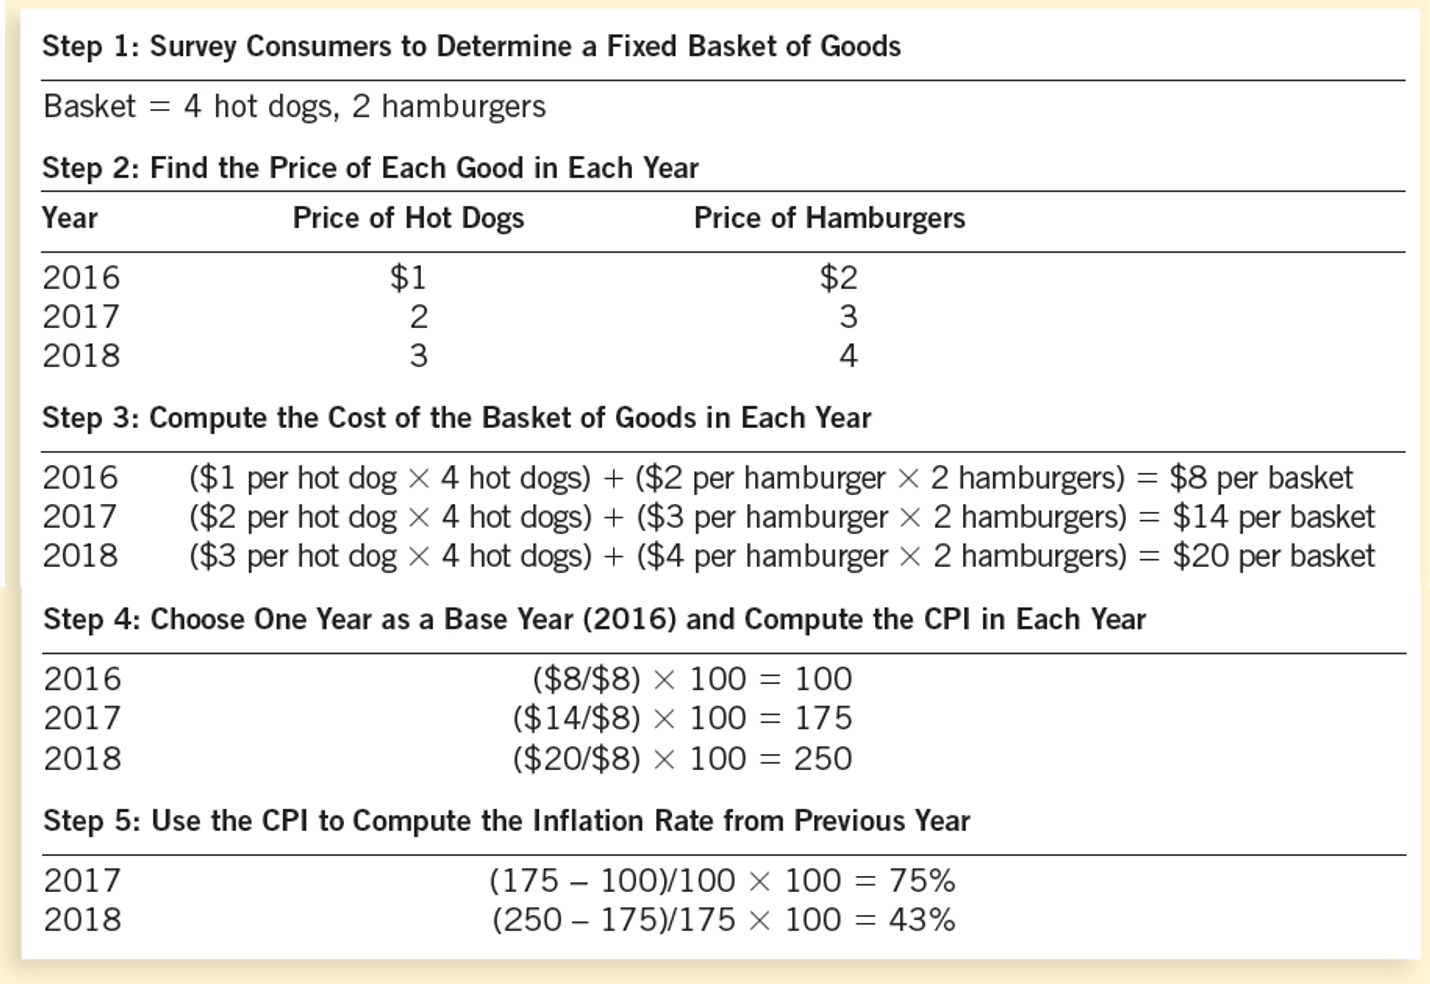
Figure 3.1: Worked-out numerical example of the calculation of CPI and inflation from hypothetical data
3.2.5.4 How the CPI Is Calculated: Video
Check out this video on the Measurement of Inflation.
3.2.6 Problems in Measuring the Cost of Living
The CPI–as it is currently measured–is an accurate measure of the market value of the goods and services that make up the typical consumer’s basket (TCB), but it is not a perfect measure of the cost of living.
Here are some of the reasons why the CPI is not a perfect measure of the cost of living:
- Substitution bias
- Introduction of new goods
- Unmeasured quality changes
3.2.6.1 Problems in Measuring the Cost of Living: Substitution Bias
The typical consumer’s basket (TCB) is not usually adjusted to reflect consumer reaction to changes in relative prices. The typical consumer will usually substitute goods and services that become relatively less expensive for those that become relatively more expensive. This adjustment by the typical consumer reduces the effect of a price increase on the typical consumer’s cost of living. But the statisticians who measure the CPI do not adjust the typical consumer’s basket of goods and services every time there is a change in some price. Consequently, the fact that the typical consumer softens the impact of price increases by running away from goods that go up in price is not captured by the way the CPI is measured. In other words, the CPI overstates the increase in cost of living by not considering consumer substitution.
Consider this hypothetical example:
- Suppose Red Apples and Green Apples are the only two commodities and are identical except for color. Suppose the typical consumer doesn’t care what color an apple is.
- Suppose the typical consumer’s basket has, for many years, contained 10 apples of each color.
- Suppose the prices in 2015 (the base year) were $2 per apple for both colors. So, the cost of the typical consumer’s basket was $40 in 2015 prices.
- Suppose the prices in 2016 increase to $4 for a Red Apple and remain unchanged at $2 for a Green Apple. This makes the cost of the typical consumer’s basket $60 in 2016 prices.
- Therefore, the CPI for 2016 with base year 2015 is 60 ÷ 40 × 100 = 150, indicating a 50% increase in the cost of living from 2015 to 2016.
Q: The CPI has increased. But has the cost of living really increased?
A: No. The consumer can switch to zero Red Apples and 20 Green Apples and enjoy the same satisfaction in 2016 as in 2015 without any increase in cost.
Therefore, we see that the CPI exaggerates the true cost of living by ignoring the typical consumer’s ability to substitute Green Apples for Red Apples when the latter become expensive.
3.2.6.2 Problems in Measuring the Cost of Living: Introduction of New Goods
New products expand the choices available to consumers. Consumers will not buy a new product unless it provides more value for money than pre-existing products. In this way, new products reduce the cost of living.
But the statisticians who measure the CPI do not adjust the typical consumer’s basket of goods and services every time a new product is introduced. So, at least until a new product is formally added to the typical consumer’s basket of goods and services, the introduction of that product does not affect the CPI.
As a result, the CPI ends up overstating the cost of living.
3.2.6.3 Problems in Measuring the Cost of Living: Unmeasured Quality Changes
If the quality of a good rises from one year to the next but its price stays the same, the consumer gets more value for his/her money.
If the quality of a good falls from one year to the next but its price stays the same, the consumer gets less value for his/her money.
The CPI ought to reflect such changes on the cost of living, but it doesn’t always do so. The Bureau of Labor Statistics in the US tries to adjust prices for changes in quality, but such changes are sometimes hard to measure.
3.2.6.4 Problems in Measuring the Cost of Living: Summary
The substitution bias, introduction of new goods, and unmeasured quality changes cause the CPI to overstate the true cost of living.
The issue is important because many government programs use the CPI to adjust for changes in the overall level of prices. Consider, for example, the Social Security pensions that senior citizens get from the government. These pensions go up proportionately whenever the CPI goes up. The idea is that increases in the CPI reflect increases in the cost of living, for which senior citizens ought to be made whole. But if the CPI exaggerates the increase in the cost of living, making pensions proportionate to the CPI overcompensates senior citizens for actual increases in the cost of living.
In cases of deflation, the problem would be of over correction in the other direction: pensions would be reduced more than the true decrease in the cost of living. But this case is less relevant because deflation is relatively rare.
The inflation calculated from the CPI has been estimated to overstate the true increase in the cost of living by about 1 percentage point per year.
3.2.7 The GDP Deflator Versus the Consumer Price Index
Economists and policymakers monitor both the GDP deflator and the CPI to gauge how quickly prices are rising. There are, however, two important differences between the indexes.
We discussed the GDP deflator in Chapter 2 (Measuring a Nation’s Income). There we saw that the GDP deflator is calculated by Equation (2.1). A side-by-side comparison of Equations (3.2) and (2.1) shows that:
- The GDP deflator reflects the prices of all final goods and services produced domestically, whereas the consumer price index reflects the prices of all final goods and services bought by consumers, irrespective of where those goods and services were produced.
- The Consumer Price Index compares the market value of a fixed basket of goods and services to the price of the basket in the base year (only occasionally does the BLS change the basket) whereas the GDP deflator compares the market value of currently produced final goods and services to the price of the same goods and services in the base year.
3.2.7.1 The GDP Deflator Versus the Consumer Price Index: Exercise
If a Pennsylvania gun manufacturer raises the price of the rifles it sells to the U.S. Army, this price hike will increase:
- Both the CPI and the GDP deflator
- Neither the CPI nor the GDP deflator
- The CPI but not the GDP deflator
- The GDP deflator but not the CPI
If there is an increase in the price of French wine sold in the United States, this price hike will increase:
- Both the CPI and the GDP deflator
- Neither the CPI nor the GDP deflator
- The CPI but not the GDP deflator
- The GDP deflator but not the CPI
Despite the conceptual differences between the CPI and the GDP deflator, the inflation numbers that we get from them tend not to be very different, as we see from Figure 3.2.
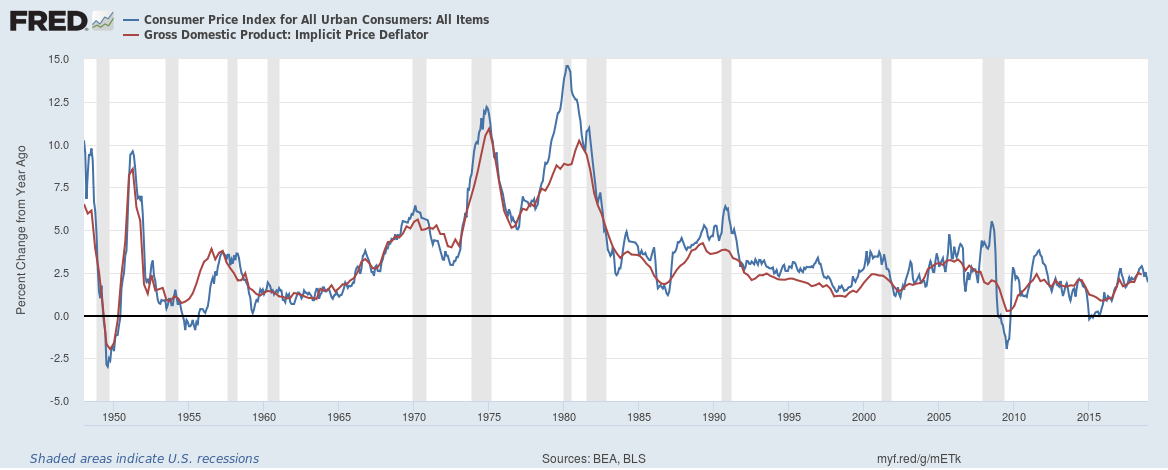
Figure 3.2: Two Measures of Inflation: from CPI and from GDP Deflator
3.3 Correcting Economic Variables For The Effects Of Inflation
3.3.1 Comparing Dollar Figures Across Time
The CPI is used to correct for the effects of inflation when comparing dollar figures from different dates.
(See the BLS’s inflation calculator.)
Quick Quiz
- Suppose CPI in 1914 = 10
- Suppose CPI in 2012 = 230
- Suppose Henry Ford paid his workers $5 a day in 1914
Q: How much is that in 2012 dollars? A: $115
Why?
The CPI rose by a multiple of 23 (= 230/10) from 1914 to 2012. So, the 2012 equivalent of the 1914 salary would have to be 23 times higher = $5 × 23 = $115.
In general, if you know a dollar amount in year \(a\), what is the equivalent dollar amount—in purchasing power—in year \(b\)?
\[\begin{equation} \textrm{Year b amount}=\textrm{Year a amount}\times\frac{\textrm{CPI in Year b}}{\textrm{CPI in Year a}} \tag{3.3} \end{equation}\]
Quick Quiz
- Suppose CPI in 1931 = 15.2
- Suppose CPI in 2012 = 229.5
- Suppose Babe Ruth earned $80,000 in 1931
Q: What 2012 salary in 2012 would have had the same purchasing power as Babe Ruth’s salary in 1931?
Note that prices rose by a multiple of 229.5 ÷ 15.2 = 15.1 over from 1931 to 2012. Therefore, the equivalent salary in 2012 is 15.1 times the 1931 salary, or $80,000 × 15.1 = $1,207,894.
Quick Quiz
If the consumer price index is 200 in the year 1980 and 300 today, then $600 in 1980 has the same purchasing power as ___ today.
- $400
- $500
- $700
- $900
3.3.1.1 Indexation
When some dollar amount is automatically corrected for inflation by law or contract, the amount is said to be indexed for inflation. For example, the social security pensions that most US retirees receive is indexed for the inflation rate calculated from the CPI. See a screen-shot from the Social Security Administration’s web site in Figure 3.3.
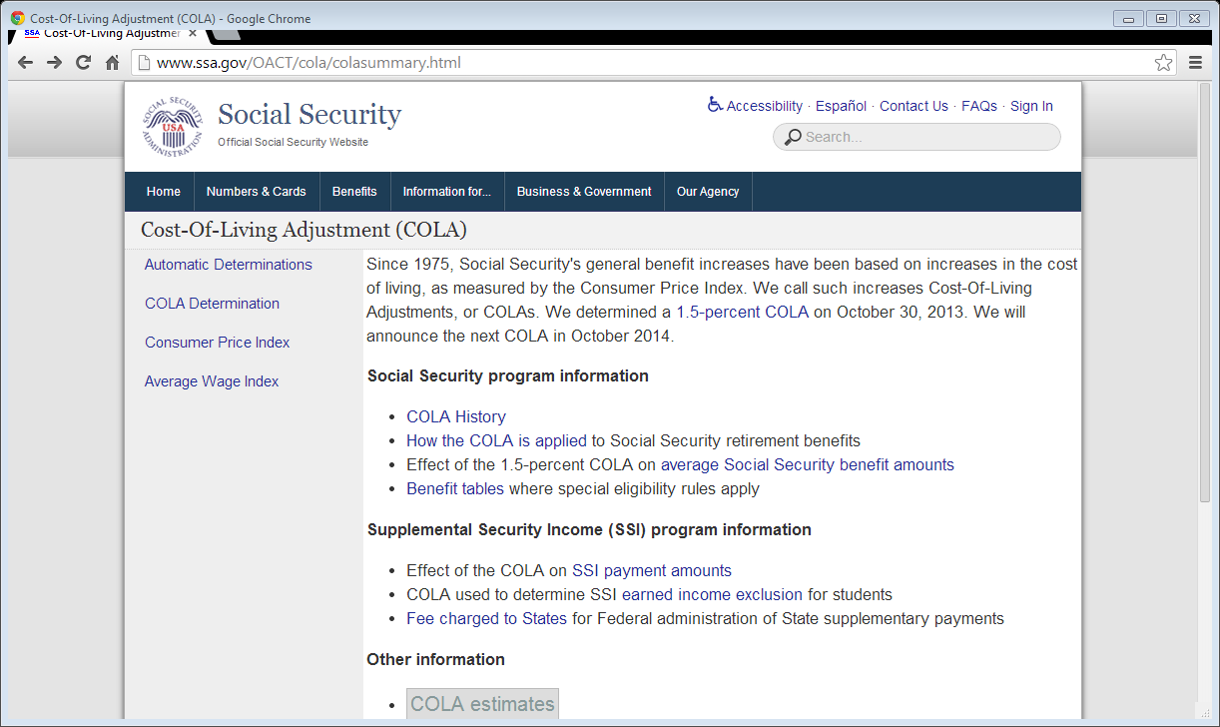
Figure 3.3: Social Security Pension Payments in the US are Indexed to the CPI
3.3.3 Correcting Economic Variables For The Effects Of Inflation: Real and Nominal Interest Rates
Interest represents a payment in the future for resources borrowed in the past. Conversely, interest represents a receipt in the future for resources loaned in the past.
The nominal interest rate is the interest rate usually mentioned in borrowing and lending contracts.
It is not corrected for inflation.
It is the interest rate that a bank pays.
The real interest rate is the interest rate that is corrected for the effects of inflation.
The inflation correction is done as in Equation (3.4):
\[\begin{equation} \textrm{real interest rate}=\textrm{nominal interest rate}-\textrm{inflation rate} \tag{3.4} \end{equation}\]
Let’s apply this equation:
- Suppose you borrowed $1,000 for one year.
- Suppose the nominal interest rate on the loan was 15%
- Suppose during the year of the loan, inflation was 10%
Then, the real interest rate = 15% - 10% = 5%
For more insight into this correction, consider the following example.
- Suppose you loaned $100 to a friend at the nominal interest rate of 15%
- So, a year later, you will get back $115
- Suppose inflation is 10%. In particular, the price of gold increased 10%.
- Had you instead bought gold with your $100, a year later you could have sold it for $110.
- So, by lending to your friend, you actually earned $5, over and above inflation.
- So, real interest rate is 5%
Note that the nominal interest rate is usually higher than zero. Would you put your money in a bank that pays -5 percent interest? In that case, if you deposit $100 today, you’d have only $95 a year later. You’d be better off keeping your cash in your wallet or under your mattress, where the $100 will remain $100 a year later. For this reason, nominal interest rates are rarely negative.
However, the real interest rate can be negative, when the inflation rate exceeds the nominal interest rate, and it often is.
Figure 3.4 shows US data on nominal and real interest rates. The nominal interest rate in this case is the 5-Year Treasury Constant Maturity Rate and the real interest rate is the 5-Year Treasury Inflation-Indexed Security, Constant Maturity. These show the interest rates that lenders to the US Treasury get for 5-year loans. The “inflation-indexed” interest rate is the real interest rate, as the name suggests. Note that the real interest rate can indeed be negative, on occasion.
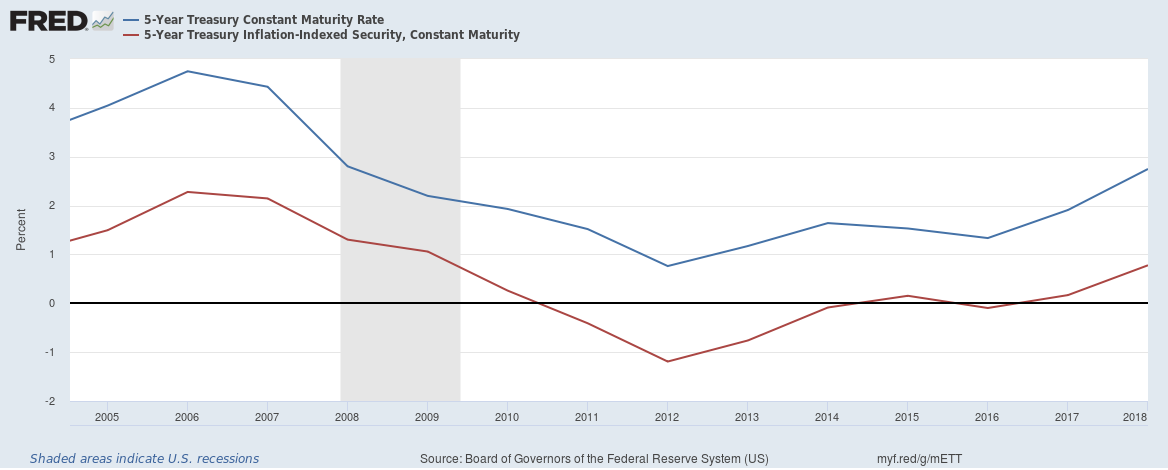
Figure 3.4: Nominal and Real Interest Rates
Quick Quiz
You deposit $2,000 in a savings account, and a year later you have $2,100. Meanwhile, the consumer price index rises from 200 to 204. In this case, the nominal interest rate is _____ percent, and the real interest rate is _____ percent.
- 1; 5
- 3; 5
- 5; 1
- 5; 3