Chapter 2 Measuring a Nation’s Income
This chapter begins our look at macroeconomics proper. Macroeconomics focuses on measurements of the economic features of entire groups of people – usually entire countries – and tries to use those measurements to deduce effective ways of running our societies. It makes sense, therefore, to begin by discussing some of the most important macroeconomic variables.
And there is no more important a macroeconomic variable than national income.
2.2 Gross Domestic Product
2.2.1 Total Income
We need to measure the health of an economy. When judging whether an economy is doing well or poorly, it is natural to look at the total income that the people in the economy are earning.
Total income is not always tied closely to economic well-being. For example, the people of a country can temporarily boost their standard of living by borrowing from others. But we can’t keep borrowing forever. This is why a nation’s standard of living depends heavily on its own total income.
2.2.2 Income = Expenditure = Output
We could measure either total income or total expenditure or total output. We would get the same number in all cases.
For an economy as a whole, income must equal expenditure because:
- Every transaction has a buyer and a seller.
- Every dollar of spending by some buyer is a dollar of income for some seller.
Moreover, total expenditure is also the monetary value of the output that is produced and sold.
This equality of income and expenditure and output has practical consequences. It gives government statisticians more choices on how to measure total income.
2.2.2.1 Saving
Q: But what about saving? People typically save part of what they earn. How then is income equal to expenditure for the economy as a whole?
A: What people save tends to get loaned to businesses who then spend the money they borrowed. So, for the economy as a whole, income must still equal expenditure.
2.2.2.2 Spending on imports
Q: But what about international trade? We buy foreign-made goods and foreigners buy goods made by us. In that case, how can our total income be equal to our total expenditure?
A: This is correct. So, it is better to say that total income of domestic residents equals the total expenditure on domestically produced goods and services.
2.2.3 Gross Domestic Product: Definition
Gross Domestic Product (GDP) is one measure of a country’s total income. There are other measures of total income, but GDP is the most popular measure.
GDP is the total market value of all final goods and services produced within a country in a given period of time.
This is not some abstract theoretical concept. We can put a number on it. For example, the GDP of the United States in 2023 was $27,360.94 billion, according to the U.S. Department of Commerce. (For more data, see this.)
2.2.3.1 Gross Domestic Product per capita
The estimated population of the United States in 2023 was 335,208,000. (For more data, see this.)
Therefore, the estimated per capita (or, per human) GDP was $81,624. (For more data, see this.)
2.2.3.2 GDP is output, expenditure, and income
Note that the definition of GDP makes it look like a measure of total output. But the idea that output = expenditure = income makes GDP a measure of expenditure and income as well.
- GDP is also the total expenditure on all final goods and services produced within a country in a given period of time.
- GDP is also the total income of all domestically located resources.
2.2.3.3 GDP is the Market Value …
In GDP, all output is valued at market prices. The market value of all sandwiches produced is both the total expenditure of the buyers of those sandwiches and the total income of the makers of those sandwiches. As our goal is to measure total income, it therefore makes sense to measure the market values of the various produced goods and add them up.
2.2.3.4 … Of All Final Goods …
We need to pause for a second over the word final. Couldn’t we have left that word out of the definition of GDP?
Final goods are those goods that are sold to their final users.
A pencil is a final good because, once produced, it is ready for purchase and use by its final users. The wood, the graphite, and other materials that disappeared in the pencil are not final goods. They will need to be transformed into a pencil before they can be useful.
GDP counts the market value of the pencil but does not separately count the wood, the graphite, and the other produced goods that make up the pencil. After all, their market value is already counted when the market value of the pencil is counted. So, counting the wood and the graphite separately in GDP would count them twice.
GDP measures the value of final goods, not intermediate goods.
Intermediate goods are those goods that disappear inside other goods that are produced for sale. Final goods are goods that are not intermediate goods. These are goods sold to their final users. GDP is defined so that the value of intermediate goods is counted only once, not twice or thrice.
Intermediate goods are goods that are sold by their producers to producers of other goods. Examples:
- milk sold by a dairy to an ice-cream company,
- grapes sold by a vineyard to a winemaker,
- printer paper sold to Kinko’s.
Final goods are goods that are sold to the final users of those goods. Examples:
- milk you buy at the supermarket,
- table grapes you buy at the farmer’s market,
- printer paper you buy for your computer printer.
- All goods made this year but not sold by year’s end are regarded as final goods (and labeled “inventories”).
Suppose a dairy farmer sells milk worth $50,000 to an ice-cream company. The farmer does not buy anything from any other firm. The total income of the dairy farmer and her employees is, therefore, $50,000. The ice-cream company uses the milk to produce ice-cream which it sells for $75,000. The ice-cream company does not buy anything from any firm other than the dairy. Therefore, the total income of the owners and employees of the ice-cream firm is $25,000. Therefore, the total income of this country is $75,000. This is accurately measured by the value of the ice-cream (the final good) alone. Had we also counted milk, the intermediate good, we would have calculated total income to be $125,000, which would have been an exaggeration.
One more example …
If nobody buys sandwiches, the total expenditure on sandwiches would be zero. Therefore, the value of the total output of sandwiches would be zero. And the income earned from the making of sandwiches would be zero.
On the other hand, if people buy a million dollars worth of sandwiches, the total expenditure on sandwiches would be a million dollars. Therefore, the value of the total output of sandwiches would be a million dollars. And note that the million dollars spent by the sandwich buyers could not simply vanish into thin air; it would have to end up in the pockets of all the people whose work contributed to the making of the sandwiches: the workers in the deli who assembled the sandwiches for their hungry customers; the bakers who baked the bread; the farmers who grew the wheat, the lettuce, and the tomatoes; the dairy farmers who made the cheese; the workers in meat-packing plants who butchered the chicken; the poultry farmers who raised the chicken; and so on and on. The million dollars spent by the consumers of sandwiches would end up as income of all the people who contributed to the making of the sandwiches.
So, just keeping track of all spending on final goods and services – which is exactly what the GDP number does – gets us measures of three things: output, income, and expenditure.
2.2.3.5 … and Services …
GDP includes both tangible goods (food, clothing, cars) and intangible services (haircuts, housecleaning, doctor visits, legal advice).
Warning: While the services of your accountant who spends her time trading stocks for you are counted in GDP, the trade in assets itself does not affect GDP. Why not? Such trade is merely the transfer of ownership of an asset from one person to another. Neither participant is paying the other for a good or service. They are simply exchanging property. Nothing new is being produced. So, GDP ignores the change in ownership.
When you buy a new car, its market value is included in GDP; after all, GDP wants to count the value of every productive activity such as the production of a car. But when you buy a second-hand car, GDP ignores the purchase; no new production took place and so GDP isn’t interested.
2.2.3.6 … Produced Within a Country …
GDP measures the value of all production within the geographic boundaries of a country. The citizenship of the owners of the resources used in production is not the key issue. Production by foreigners living in Country A is counted in Country A’s GDP. Production by a Country A’s citizens working in Country B is counted in Country B’s GDP.
2.2.3.7 … In a given period of time
GDP measures the value of production that takes place within a specific interval of time, usually a year or a quarter (three months).
GDP in period \(T\) measures the value of goods and services produced in period \(T\). GDP does not care whether those goods were sold in period \(T\) or in period \(T+1\) or in some later period. The market value of goods produced in period \(T\) but not sold in period \(T\) are called inventory accumulations.
GDP ignores current transactions that involve goods that were produced in the past. Current transactions involving used cars or buildings that were constructed in the past are not counted in current GDP either (as was discussed earlier).
2.2.4 What productive activity is not counted in GDP?
GDP includes the market value of all items produced in the economy and sold legally in markets. It excludes items produced and sold illicitly, such as illegal drugs.
GDP excludes most items that are produced and consumed at home and that never enter the marketplace.
For more on Gross Domestic Product, check out this video.
2.3 Nominal and Real GDP
How can we measure a nation’s productive activity in different years so that the numbers can be compared across time?
The GDP we have seen so far is more precisely called Nominal GDP. One can’t use data on nominal GDP for 1915 and 2015 to draw a meaningful conclusion about productive activity in those two years.
GDP comes in two flavors:
- Nominal GDP (also called GDP at current prices), and
- Real GDP (also called GDP at constant prices)
So, when you see or hear a discussion of GDP, be sure to ask, “Which GDP are you talking about? Nominal or real?”
2.3.1 Gross Domestic Product, Nominal
Nominal GDP is the total market value of all final goods and services produced within a country in a given period of time. The market value is calculated using current prices, the prices that prevailed when the production took place.
For example, the nominal GDP of the United States in 2017 was $19,390.6 billion, according to the U.S. Department of Commerce. Given a mid-year population of 325,983,000 (est.) the per capita (or, per human) nominal GDP was $59,484.
2.3.2 Gross Domestic Product, Real
Real GDP is the total market value of all final goods and services produced within a country in a given period of time. This is the same as for nominal GDP, but there’s a twist. The market value is now calculated using constant prices, the prices that prevailed in a benchmark year called the base year.
For example, the real GDP of the United States in 2017 was $17,096.2 billion in 2009 dollars, according to the U.S. Department of Commerce. Given a mid-year population of 325,983,000 (est.) the per capita (or, per human) real GDP was $52,445 in 2009 dollars.
To further explore the difference between the calculation of Nominal GDP and Real GDP, take a look at Figure 2.1. It presents a numerical example showing the calculation of nominal and real GDP, this time with hypothetical data:
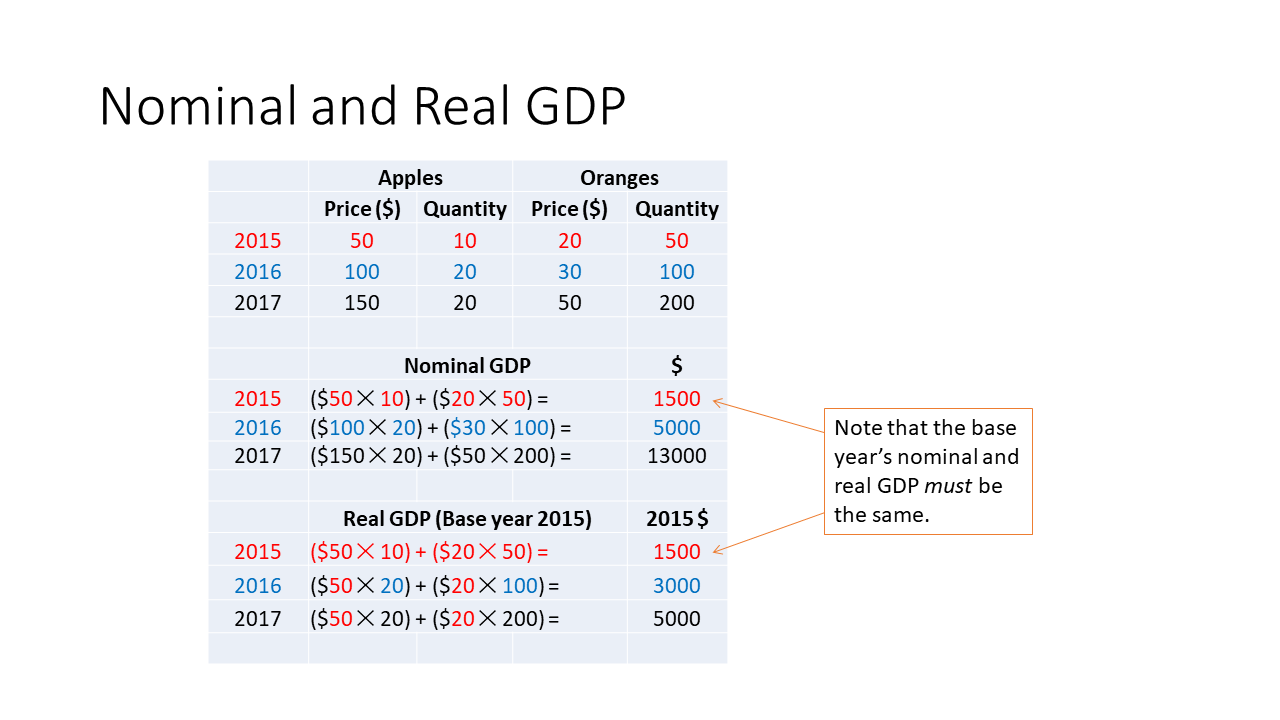
Figure 2.1: Calculation of Nominal and Real GDP with hypothetical data
For more on Nominal vs. Real GDP, see this video.
And here’s a chart showing Nominal and Real GDP for the US:
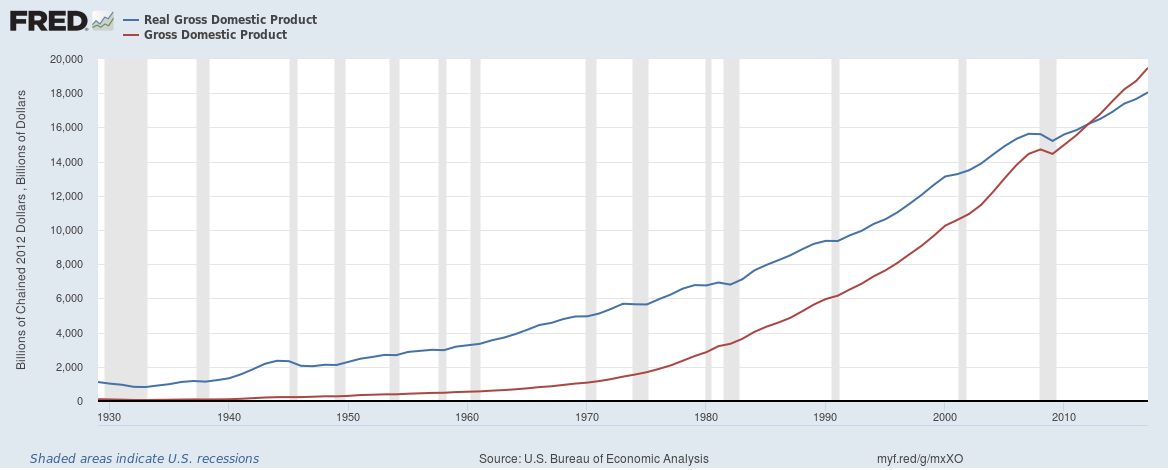
Figure 2.2: Real GDP in 2012 Dollars and Nominal GDP
2.3.3 The GDP Deflator
The GDP deflator is a measure of the overall level of the prices of the final goods and services produced within a country during a given period of time. The GDP Deflator tells us how much of the rise in nominal GDP over a period of time is attributable to a rise in prices (rather than to a rise in production). The GDP Deflator is calculated as follows: \[\begin{equation} \textrm{GDP Deflator for 2018 with Base Year 2009}\equiv\frac{\textrm{Nominal GDP in 2018}}{\textrm{ Real GDP in 2018 with Base Year 2009}}\times 100 \tag{2.1} \end{equation}\]
Example: In 2013, US Nominal GDP was $16,803.0 billion. US Real GDP was $15,767.1 billion (in chained 2009 dollars). Therefore, US GDP Deflator = (16,803.0/15,767.1) × 100 = 106.57. This means that the final goods and services produced in 2013 had a market value in 2013 prices that was 106.57 percent of their market value in 2009 prices. This means that, roughly, final goods and services were on average 6.57% pricier in 2013 than in 2009.
Figure 2.3 presents another numerical example showing the calculation of nominal and real GDP, again with hypothetical data, and emphasizing the calculation of the GDP Deflator:
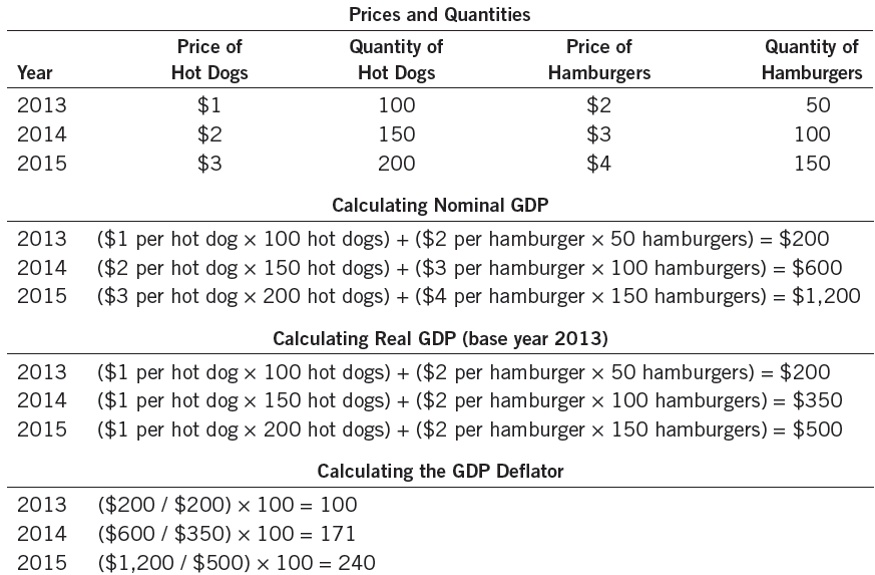
Figure 2.3: Calculation of Nominal GDP, Real GDP, and the GDP Deflator with hypothetical data
By the way, why do we call the GDP Deflator a deflator? Nominal GDP changes from one year to the next partly because of inflation. Real GDP, on the other hand, changes because of changes in production alone. The GDP Deflator can convert Nominal GDP to Real GDP by deflating the effect of inflation in Nominal GDP. Hence, the name deflator.
2.3.3.1 Converting Nominal GDP to Real GDP using the GDP Deflator
Note that Equation (2.1) above can easily be re-written as follows: \[\begin{equation} \textrm{Real GDP in 2018 with Base Year 2009}\equiv\frac{\textrm{Nominal GDP in 2018}}{\textrm{GDP Deflator for 2018 with Base Year 2009}}\times 100 \tag{2.2} \end{equation}\]
Therefore, if you know the numbers for Nominal GDP and the GDP Deflator, you can calculate Real GDP.
2.4 The Growth Rate of GDP
Consider the value of a variable at two dates. The growth rate of the variable over the intervening period is the increase in the value of the variable from the earlier date to the later date divided by the value of the variable at the earlier date. Multiply by 100 to express the growth rate as a percentage, if you wish.
In the case of the annual growth rate of GDP, see Equation (2.3): \[\begin{equation} \textrm{GDP Growth Rate in 2018}\equiv\frac{\textrm{GDP in 2018} - \textrm{GDP in 2017}}{\textrm{GDP in 2017}}\times100 \tag{2.3} \end{equation}\]
Note that the growth rate could be negative, if GDP decreases over time.
Figure 2.4 continues with the hypothetical data in Figure 2.1 and calculates the growth rate of GDP:
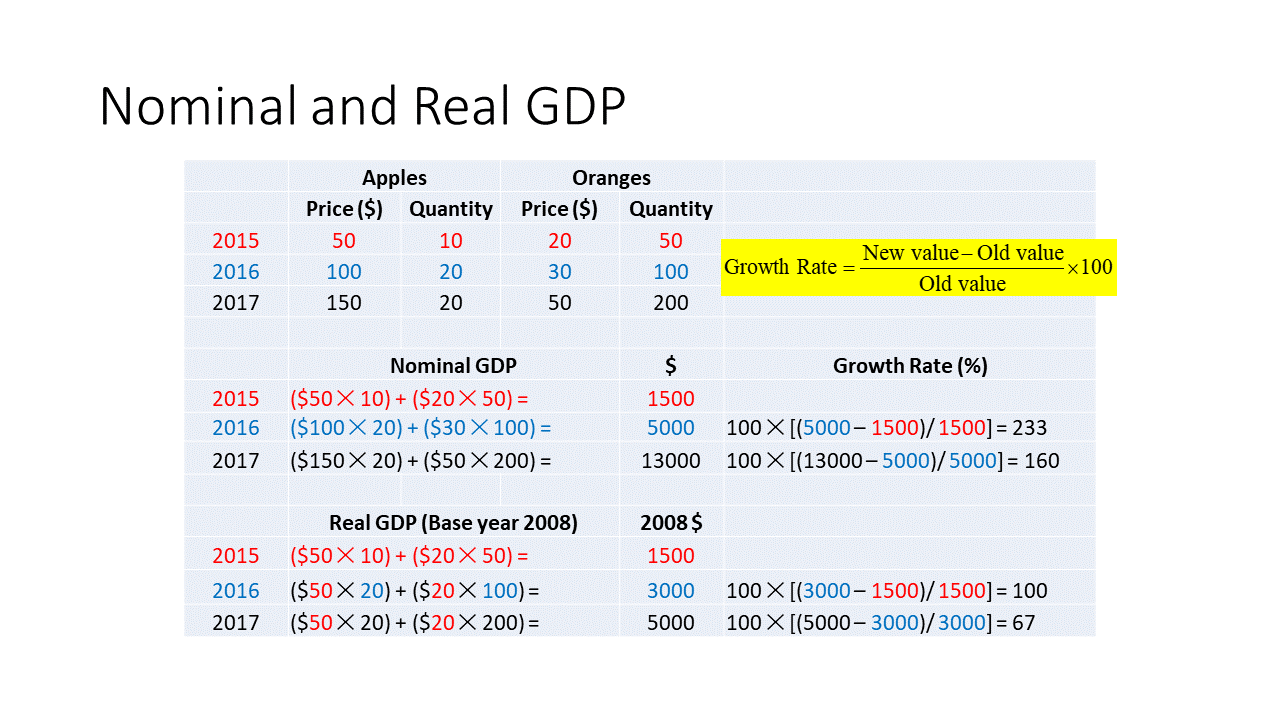
Figure 2.4: Calculation of Nominal GDP, Real GDP, and their growth rates with hypothetical data
Returning to actual data, here’s a chart showing the growth rates of real GDP for the United States:
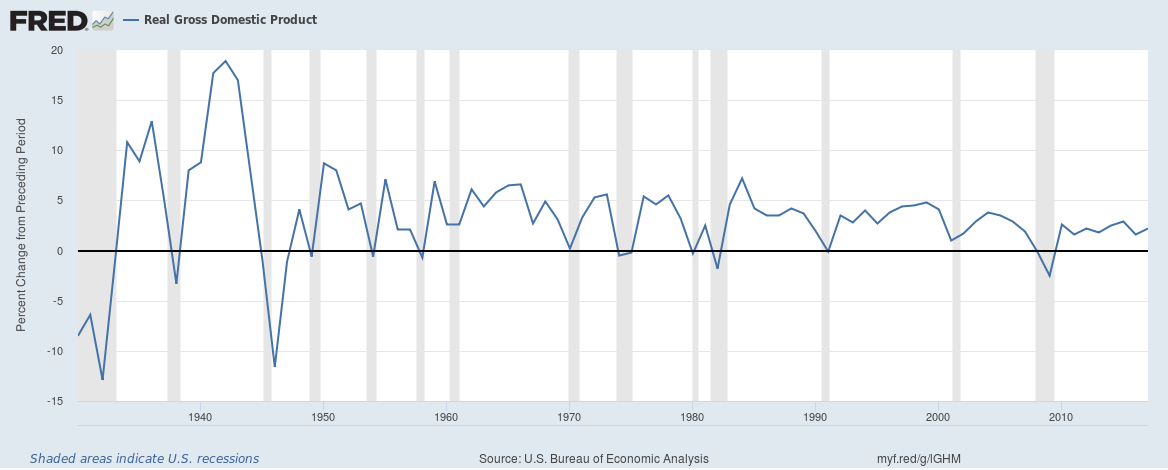
Figure 2.5: Annual Growth Rate of Real GDP in 2012 Dollars
2.5 GDP and the Components of GDP
We need to pay attention not only to the total expenditure on all final goods and services made in a country (that is, to GDP, nominal or real), we also need to watch where the expenditure is coming from. That way, when there’s a recession, we’ll know which sector needs the most attention.
Expenditure on “Made in USA” final goods and services can come from only these four sources:
- Households (Consumption expenditure)
- Businesses (Investment expenditure)
- Government entities (Government purchases)
- Foreigners (Exports)
So, one might think that: \[\textrm{GDP} = \textrm{Consumption Spending} + \textrm{Investment Spending} + \textrm{Government Spending} + \textrm{Exports}.\] But that would be incorrect!
The correct equation linking total expenditure (or, GDP) to its component expenditures is instead the following: \[\textrm{GDP} = \textrm{Consumption Spending} + \textrm{Investment Spending} + \textrm{Government Spending} + \textrm{Exports}-\textrm{Imports}.\]
Q: Why do we subtract imports?
A: GDP is the market value of all final “Made in USA” goods. But consumption, investment, and government purchases all include spending on foreign goods. Therefore, to make the two sides of the equation the same, we must take out all the imports.
Exports – Imports is called Net Exports.
2.5.1 The Four Components Of GDP
- Consumption (\(C\)): The spending by households on goods and services, with the exception of purchases of new housing.
- Investment (\(I\)): The spending on capital equipment, inventories, and structures, including new housing.
- Government Purchases (\(G\)): The spending on goods and services by local, state, and federal governments. Does not include transfer payments because they are not made in exchange for currently produced goods or services.
- Net Exports (\(NX\)): Exports minus imports.
Throughout these lecture notes, real GDP will be denoted by the symbol \(Y\). Then, the last equation above becomes: \[\begin{equation} Y=C+I+G+NX. \tag{2.4} \end{equation}\] This equation, which will be used again and again throughout this book is called the national income identity.1
For more on the link between GDP and its components, see this video.
2.6 International GDP comparisons
How can we measure national productive activity so that the numbers can be meaningfully compared across nations?
When the GDP numbers for various countries are compared, the same currency units must be used. There are two ways of converting from national currencies to a common currency, such as the US dollar:
- Use market exchange rates
- Use a common set of prices (Purchasing Power Parity)
2.6.1 Market Exchange Rate Method
- Step 1: Look up Mexico’s GDP in Mexico’s currency, the peso.
- Step 2: Look up how many US dollars one Mexican peso is worth.
- Step 3: Multiply the numbers in Steps 1 and 2.
This gives you Mexico’s GDP in US dollars. When the GDPs of two countries are both expressed in US dollars, they can be compared head to head.
2.6.2 Purchasing Power Parity Method
- Step 1: Find out the quantities of all the final goods that were produced in Mexico during, say, 2016
- Step 2: Find out the prices of those goods in the United States–not Mexico–in 2016. These prices are in US dollars.
- Step 3: Calculate Mexico’s GDP in US dollars, by
- Step 3a: multiplying the quantities in Step 1 by the corresponding prices in Step 2 and
- Step 3b: then adding the results obtained in Step 3a
2.6.3 Let’s Compare the Two Methods
- GDP per capita (current US$)
- GDP per capita, PPP (current international $)
- GDP per capita (constant 2010 US $)
- GDP per capita, PPP (constant 2011 international $)
Let’s Compare GDP! Let’s Compare GDP per capita!
For more on the basic facts of economic prosperity across countris, see this video
2.7 Is GDP a good measure of economic well-being?
No, but real GDP per capita is the best one-number measure of well-being that we have.
There’s a lot about well-being that’s missing in GDP: economic inequality, work done at home, volunteer work, illegal work, leisure, environment, disasters, …
2.7.7 GDP Ignores Consumer Surplus
- Free digital technology,
- Free Apps,
- Google,
- Google maps,
- Wikipedia,
- OpenOffice,
- YouTube,
- Freely available education (Khan Academy, Coursera)
… None of this adds to GDP.
Users would be willing to pay but don’t. They get Consumer Surplus.
2.7.9 There’s a lot more to life than production
Here’s Robert F. Kennedy reminding us of all that is missing in GDP:
(Gross Domestic Product) does not allow for the health of our children, the quality of their education, or the joy of their play. It does not include the beauty of our poetry or the strength of our marriages, the intelligence of our public debate or the integrity of our public officials. It measures neither our courage, nor our wisdom, nor our devotion to our country. It measures everything, in short, except that which makes life worthwhile, and it can tell us everything about America except why we are proud that we are Americans.
2.7.10 So, in the final analysis …
GDP is the best single measure of the economic well-being of a society. GDP per person tells us the income and expenditure of the average person in the economy.
For more on the link between Real GDP Per Capita and the Standard of Living, see this video.

An identity is an equation that is always true, simply by virtue of the way the variables in the equation are defined.↩︎